Parametric Evaluation of Mechanical and Surface Characteristics in FDM-Based 3D Printing
Pritam Pain*, Goutam Kumar Bose and Bipradas Bairagi
Department of Mechanical Engineering, Haldia Institute of Technology, Haldia, India
E-mail: pritam.me.dscsdec@gmail.com
*Corresponding Author
Received 04 February 2026; Accepted 01 March 2026
Abstract
This study investigates the influence of key process parameters – printing speed, temperature, and layer height – on the performance characteristics of three widely used Fused Deposition Modelling (FDM) materials: polylactic acid (PLA), acrylonitrile butadiene styrene (ABS), and nylon. The primary objective is to optimise surface roughness, shear strength, and wear resistance using advanced modelling and optimisation techniques. An L9 orthogonal array was used to vary the process parameters in the experimental design systematically. Analysis of Variance (ANOVA) was conducted to identify the factors that significantly influence surface roughness, shear strength, and wear resistance. Regression analysis and signal-to-noise (S/N) ratio charts were employed to assess the impact of each parameter. An Artificial Neural Network (ANN) was trained on the experimental data to predict shear strength and wear resistance accurately. Finally, a Genetic Algorithm (GA) was applied for multi-objective optimisation to simultaneously minimise surface roughness and wear resistance while maximising shear strength. The ANN model exhibited excellent predictive performance, with R-values of 0.99687 for shear strength and 0.91182 for wear resistance. The best parametric combination – 30 mm/s printing speed, 230∘C temperature, and 0.1 mm layer height – yielded 114 MPa shear strength, 94 m surface roughness, and 0.08 wear resistance. Nylon demonstrated the highest shear strength and wear resistance under specific process conditions, while PLA provided the lowest surface roughness at optimal settings. The integration of ANN and GA provides a robust framework for process optimisation in FDM. The findings offer a basis for developing adaptive control strategies and reducing post-processing costs, contributing to improved performance and manufacturability of 3d-printed components.
Keywords: 3D printing, S/N ratio, ANN, FDM, GA.
1 Introduction
Additive manufacturing (AM) is a sophisticated method for producing intricate geometries and structures by depositing material in layer form, based on 3d model data. Additive manufacturing is also called rapid prototyping, on-demand manufacturing, digital fabrication, desktop manufacturing, solid freeform manufacturing, layer manufacturing, direct manufacturing techniques, or 3d printing. The AM process starts with designing a 3d design by using computer-aided design (CAD) software, which is sliced into layers by slicing software and then used to instruct the printer to fabricate the part through techniques like material extrusion, VAT polymerisation, or powder bed fusion. Polymers, metals, ceramics, and composites are typical materials used. Fused Deposition Modelling (FDM) is a popular additive manufacturing technology, invented by Stratasys in 1988. It produces parts layer by layer by extruding hot thermoplastic materials from a heated nozzle. The process starts with loading filament material into the extruder, which gets melted and deposited upon the build platform based on the design specified in the CAD model. It hardens as it cools down, forming the intended three-dimensional object. A summary of the previous literature relevant to the earlier study is provided in this section. Product manufacturing applies more advanced business models in engineering and manufacturing, presenting many production and consumption options without facing huge challenges [1]. The mechanical performance of ABS is highly dependent upon FDM parameters, where the raster angle and gap influence properties; however, a negative gap shows increased performance, while a positive gap lowers the performance [2]. The laser treatment on the BMGMC samples modifies the microstructure. It changes the size, morphology, and dispersion of the CuZr B2 phase into the base metal, heat-affected zone, and fusion zone. The technique was applied to document the treatment and emphasise the complexity of the thermal history of metallic AM parts/alloys [3]. The areas where Advanced Manufacturing (AM) changes the industry’s face are geometry processing and material design. Because of the emergence of AM, geometry processing and material design benefits have been made available in education [4]. Gu et al. explore the utilisation of powder materials in laser-based material characterisation (AM) of metallic components, especially their physical properties, densification mechanisms, and the relation between the material, process, and metallurgical mechanisms [5]. Through intensive research over the last twenty years, tremendous growth has been made in the development and commercialisation of new and innovative AM processes, and numerous practical applications have been developed in aerospace, automotive, biomedical, energy, and other fields. Thus, through intensive research, AM technology has made tremendous progress through advancing its applications in various fields and has shown significant progress in the field of research [6]. The relationship of AM processes with materials is complex and includes laser and electron beam melting. Typical microstructures of additively manufactured steel, aluminium, and titanium that are presented go along with properties evolving under static as well as dynamic loading [7]. A comparison of cost, traditional injection moulding vs layer manufacturing techniques (stereolithography, fused deposition modelling, laser sintering), shows that in certain geometries, layer manufacturing techniques can become more economical [8]. Rapid prototyping techniques develop shaped objects by iteratively adding material. These methods are distinct from shaping and material removal manufacturing processes. Ten years of research and development in rapid prototyping, focusing on process-by-process details and technological and economic trends [9]. Metallic materials fabricated by direct energy deposition and powder bed fusion are evaluated in terms of strength, toughness, and the formation of fatigue cracks [10]. Polymer processing is a crucial aspect of advanced polymer systems, particularly in additive manufacturing (AM). Techniques like sheet lamination, extrusion, and 3d bioprinting are used to create a range of polymers, including thermoplastics, thermosets, elastomers, hydrogels, functional polymers, and biological systems. These polymers are used in various applications, including lightweight engineering, architecture, food processing, optics, energy technology, dentistry, and personalised medicine [11]. This new development of a metal/polymer composite material for FDM rapid prototyping involves cost and time savings. The feedstock consists of iron particles dispersed within a nylon-type matrix. An experimental investigation has been carried out on the thermal properties compared to other composites. Feedstock filaments were successfully used in an unmodified FDM system for injection moulding inserts [12]. The well-ordered tissue constructs in human tissues and organs are created using computer-aided design techniques in additive manufacturing. The spatial variations of cells and biomaterials are produced in these techniques, which would speed up the process of understanding how to create tissue and its function. That is still insufficient, though, because the availability of suitable polymers is still below expectations, and the application already needs practicality [13]. 3d printing is the additive production technique that produces an object layer by layer based on a CAD program. It improves the times of production times for small parts and is flexible. Fused Deposition Modelling FDM employs plastic filament and heated extrusion nozzles. Various challenges and mechanical properties are presented in the production process with different materials [14]. The FDM technique is a critical element of 3d printing and material requirements. This part briefly discusses the pros and cons of recycled, bio-based, and blended thermoplastics, and available solutions for improving their mechanical properties before, during, and after the printing process [15]. The thermal and mechanical properties of new metal-particle-filled ABS composites developed for Fused Deposition Modelling applications are presented. DMA techniques were adopted to characterise the viscoelastic properties. It was found that the inclusion of the metallic filler in the composite improved the thermal and mechanical properties of ABS. Thus, such composite applications in various fields can help achieve high-performance prototypes on FDM platforms [16]. Additive manufacturing (AM) involves the formation of parts from powder, wire, or sheets using various techniques developed for melting or solid-state joining. Techniques are targeted at processing defects, heat transfer, solidification, solid-state precipitation, mechanical properties, and post-processing metallurgy. New efforts focus on new material developments for commercial production [17]. Additive manufacturing, also popularly known as 3d printing, is one of the popular processing methods of fibre composites, which has received a great deal of attention in terms of high performance and durability. However, the inherent strength of these composites is quite lower in comparison to the conventional methods of injection moulding. This article reviews the analysis of the performance of FDM-fabricated polymer-fibre composites during mechanical testing and the observed properties, along with the effect of various processing parameters on the resultant thermal properties [18]. Layer structures as well as road structures have a direct significant effect on the mesostructure and mechanical properties of polymer chains. Schemes of deposition, such as adaptive slicing and curved layer deposition, are critical to achieve the maximum connectivity and continuity of polymer chains in their network. Curved layer deposition is suggested for FDM, particularly for thin shell-like parts, to ensure fibre continuity. An enhancement in the mathematical models of curved slicing towards improved mechanical characteristics in printed parts has be en established [19]. Recent decades have witnessed tremendous growth in Additive Manufacturing technologies, concentrating more on the evolution of engineering design and taking advantage of the possibilities of the technology while its constraint is mitigated. It provides opportunities, constraints, and economic considerations for design for AM production with key industrial applications, future challenges, and promising research directions for maximising AM’s potential in the industry [20]. Orthopaedic regenerative medicine uses the principle of mimicking the biomechanical properties of host bones in the design of bone scaffolds and implants. Porous metals offer flexible stiffness and porosity, hence enabling the in-growth of bone tissue, which further accelerates osseointegration. Additive manufacturing, a more recent manufacturing technique, now offers complex structures with customised mechanical performance. Topology optimisation techniques allow porous metals to achieve specified mechanical properties, hence, the implants designed by this approach of additive manufacturing are of interest [21]. Wire + Arc Additive Manufacturing is a manufacturing technology enabling large, critical components to be deposited in metals such as titanium, aluminium, and steel. This process provides higher deposition rates, low material and equipment costs, and good structural integrity for use as a replacement for low and medium-complexity parts [22]. Additive manufacturing is revolutionising the manufacturing industry by offering strength and accuracy. Despite much research and development, additive manufacturing has become the most crucial part of the future of manufacturing, despite an improvement in handling various materials [23]. The work studies characteristic features of the FDM process in producing the product using PLA, ABS, and Nylon by investigating Compressive Strength, surface roughness (Ra), and Wear Resistance by doing experimental studies on various process parametric combinations of Printing Speed (PS), Printing Temperature (PT), and Layer Height (LH). ANOVA was used to analyse this experimental data. Concerning the Taguchi Methodology, the Signal to Noise Ratio (S/N ratio) reveals how significant process parameters will affect the individual response [24]. A broad overview of Additive Manufacturing (AM) technologies, highlighting their ability to create complex geometries layer by layer, which is crucial for micro-scale component fabrication. This review establishes the foundation for understanding AM’s potential and challenges in producing micro-devices, a key focus of micromechanics and microengineering. Additive manufacturing, particularly using the FDM process, was analysed in this study with three polymers: PLA, ABS, and Nylon. Key control parameters – work material, printing speed, temperature, and layer height – were examined for their effects on surface roughness, compressive strength, and wear resistance. An L9 orthogonal array and Taguchi methodology identified significant parameters using ANOVA. S/N ratio graphs illustrated their impact, and regression analysis further validated the findings. The response data were processed through an artificial neural network for training and testing. A genetic algorithm (GA) optimised the parametric combinations, resolving contradictions in response objectives. The GA yielded a unique set of optimal parameters and corresponding responses, improving efficiency in manufacturing complex geometries.
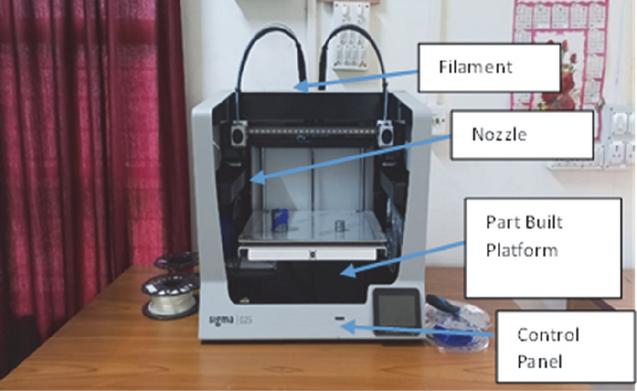
Figure 1 FDM machine.
2 Method
The present experimental study was conducted on Delta WASP 2040 Industrial X with Sigma D25 as shown in Figure 1. Three different polymer material filaments were used, namely, PLA (Polylactic Acid), ABS (Acrylonitrile Butadiene Styrene) and Nylon. Figure 2 shows the product developed in different polymer materials. Other variable parameters that are considered are Printing Speed, Printing Temperature and Layer Height. Three different responses, such as surface finish, shear strength and wear resistance, are measured during the experimentation following the L9 orthogonal array. The Perthometer M1 is a stylus-type profilometer produced by Mahr Gmbh and is used to determine the surface finish of the product, which is expressed in m as Ra. A shear strength test is done on the objects with the help of a Universal Testing Machine of TUE-C-100. The wear resistance test is done by using a Tribotester of (TR-20LE) DUCOM make. Depending upon the capacity of the FDM machine, the control parameters and their levels are shown in Table 1. The optimisation of 3d printing parameters using PLA, ABS, and nylon materials was the primary focus of this research. The analysis is done using Minitab 17 software.
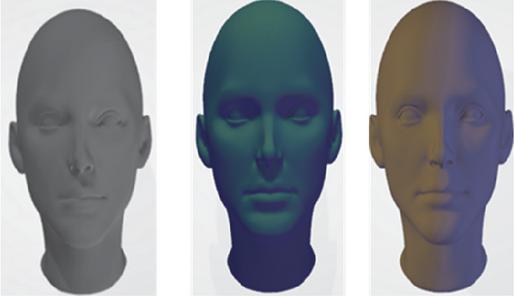
Figure 2 Product in (a) PLA, (b) ABS, (c) Nylo.
Table 1 Control parameters and levels
| Levels | |||||
| Control Parameters | Symbols | Units | L1 | L2 | L3 |
| Printing Speed | PS | mm/s | 30 | 50 | 70 |
| Printing Temp | PT | ∘C | 190 | 210 | 230 |
| Layer Height | LH | mm | 0.1 | 0.2 | 0.3 |
3 Results
3.1 Analysis Using ANOVA
The graph of the S/N ratio is an analytical tool for Response Surface Methodology. It could be applied to determine the robustness of the process, which is defined by three responses: wear resistance, surface roughness, and strength. The higher values of the S/N ratio indicate stability and lower sensitivity to parameter variability. The smaller values will account for a smoother surface with the best strength.
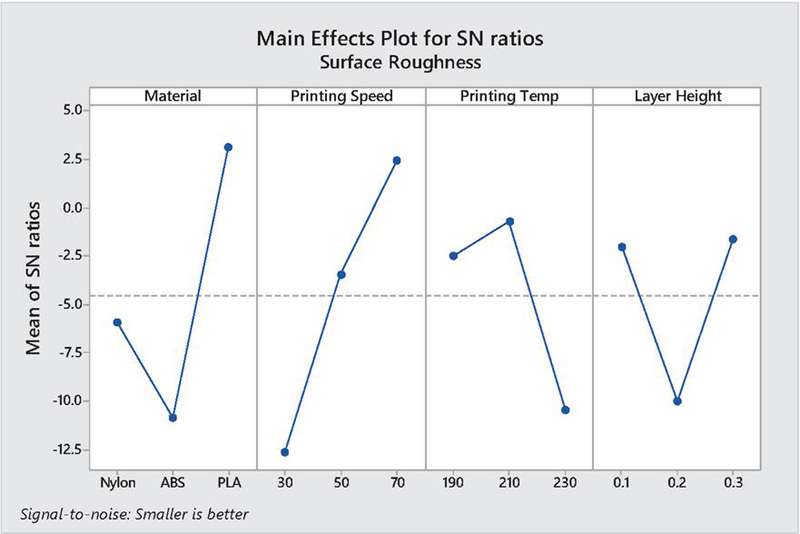
Figure 3 S/N ratio for surface finish.
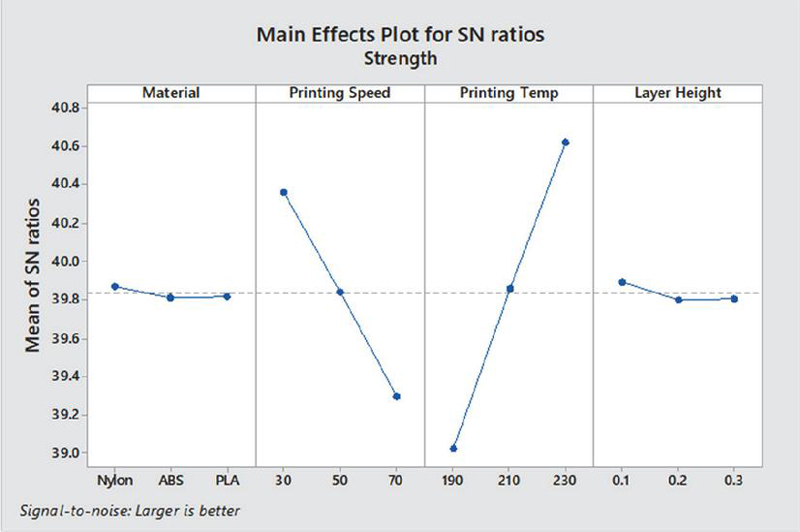
Figure 4 S/N ratio for strength.
The S/N Ratio Plot, as illustrated in Figure 3, shows how material, print speed, print temperature, and layer height affect the factors of surface roughness. The better surface is observed using PLA, printing speed of 70 mm/s, Printing Temperature of 210∘C and layer height of 0.3 mm.
The S/N Ratio Plot, as illustrated in Figure 4, shows how material, print speed, print temperature, and layer height affect the factors of strength. The maximum strength has been observed for Nylon while Printing Speed is 30 mm/s, Printing Temperature of 230∘C and layer height of 0.1 mm.
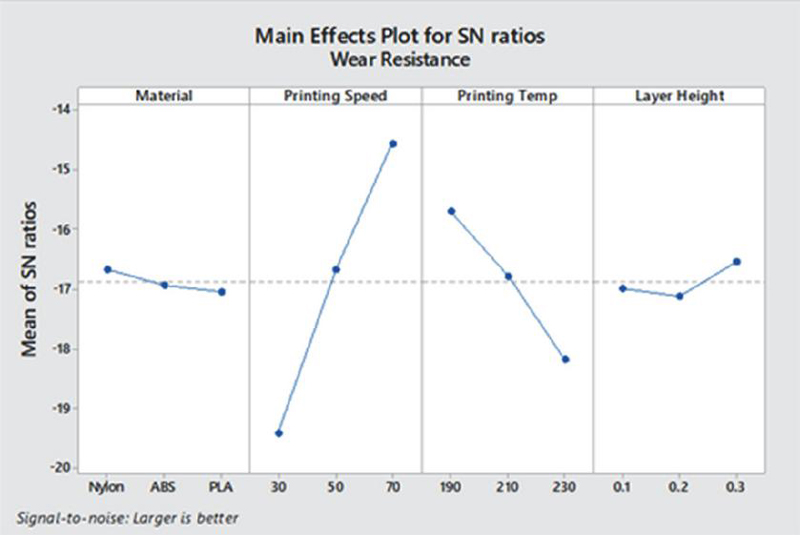
Figure 5 S/N ratio for wear resistance.
The S/N Ratio Plot, as illustrated in Figure 5, indicates that maximum wear resistance is observed using Nylon at the Printing Speed of 70 mm/s, Printing temperature of 190∘C and Layer height of 0.3 mm.
3.2 Result Analysis Using ANN
The Box–Behnken design, a response surface methodology (RSM) approach, was adopted for developing the second-order regression models using the control parameters – Printing Speed, Printing Temperature, and Layer Height – and the measured responses – Strength, Surface Roughness, and Wear Resistance. It is important to note that no additional physical experiments were conducted under the Box–Behnken design. The model was used only to generate the quadratic regression equations required for ANN training and Genetic Algorithm (GA) optimisation.
An Artificial Neural Network (ANN) was employed for predictive modelling. A two-layer feedforward network with sigmoid activation functions in the hidden layer and linear activation functions in the output layer was used, which is suitable for regression problems. The Levenberg–Marquardt algorithm was applied as the training function to minimise the Mean Squared Error (MSE). In all cases, 70% of the data were used for training, 15% for testing, and the remaining 15% for validation.
Figure 6 illustrates the relationship between the predicted surface roughness (output) and the actual surface roughness (target) for the training, validation, and test datasets. The model demonstrates strong predictive capability, indicating that it successfully captures the relationship between the input parameters and surface roughness.
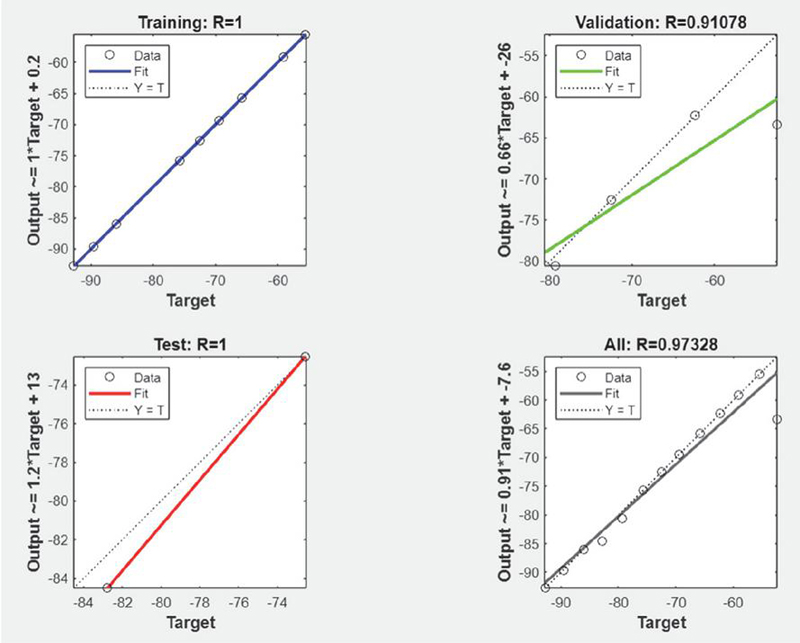
Figure 6 Surface roughness regression plot.
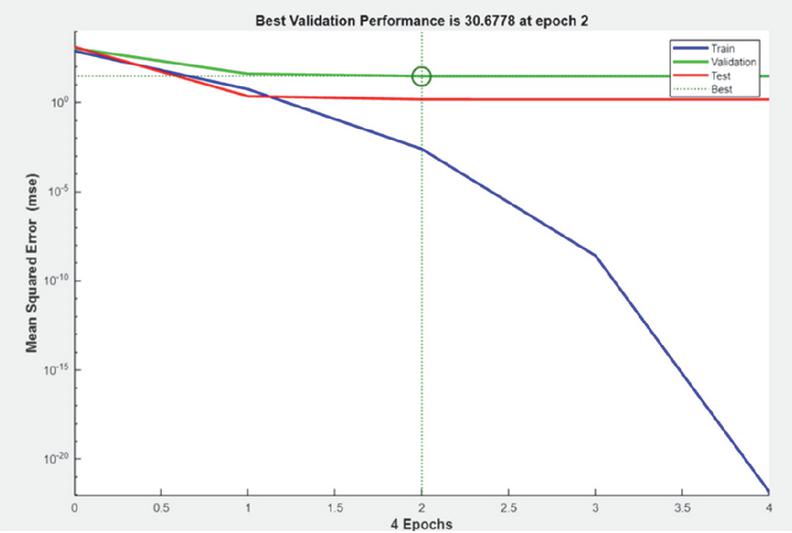
Figure 7 Surface roughness performance graph.
Figure 7 illustrates the performance of an Artificial Neural Network (ANN) model trained to predict surface roughness based on various printing parameters. The graph suggests that the ANN model overfits after a few epochs. The best validation performance achieved at epoch 2 suggests that further training might not improve the model’s generalisation ability.
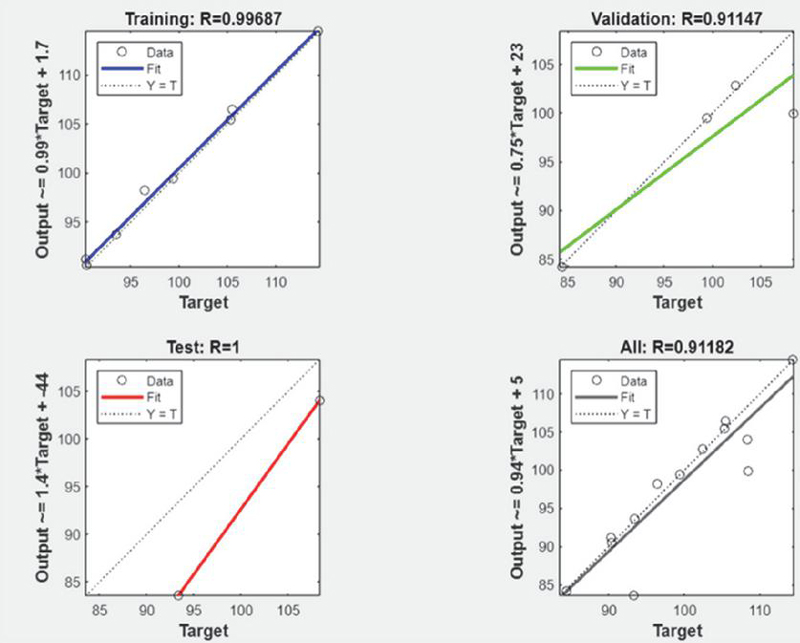
Figure 8 Shear strength regression plot.
Figure 8 shows the regression graphs of Artificial Neural Network (ANN) modelling applied to predict the Shear Strength response of 3d-printed samples (PLA, ABS, and Nylon) under various process parameters (Printing Speed, Printing Temperature, Layer Height). The ANN model fits the training data well, as evident by the high R-value (0.99687). This indicates the model has effectively captured the underlying relationship between process parameters and the Shear Strength response. With an overall R-value of 0.91182, the model demonstrates good predictive capability.
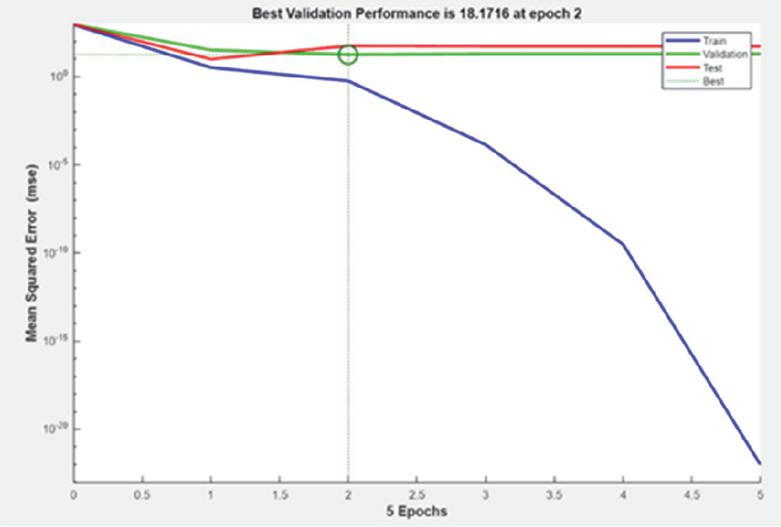
Figure 9 Shear strength performance graph.
Figure 9 illustrates the performance of an Artificial Neural Network (ANN) model trained to predict shear strength based on various printing parameters. The key metric used to assess the model’s performance is Mean Squared Error (MSE). The graph suggests that the ANN model overfits after a few epochs. The best validation performance was achieved at epoch 2. The model’s performance at this point is a good balance between fitting the training data and generalising it to new data.
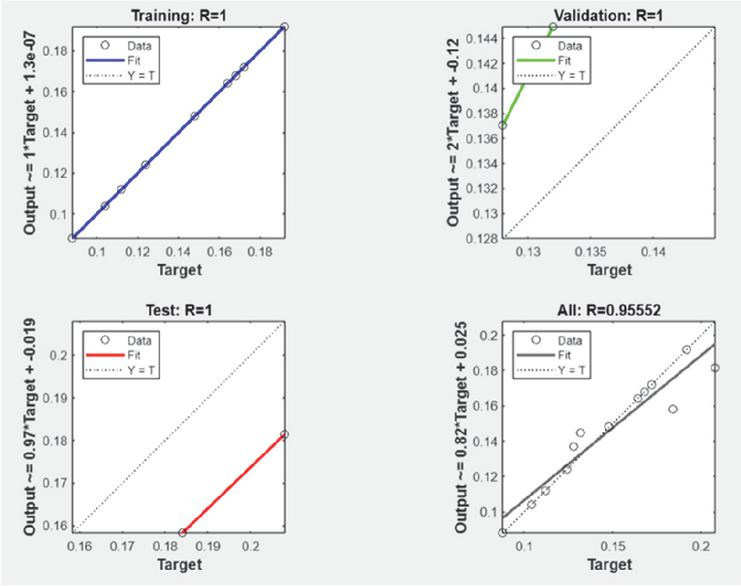
Figure 10 Wear resistance regression plot.
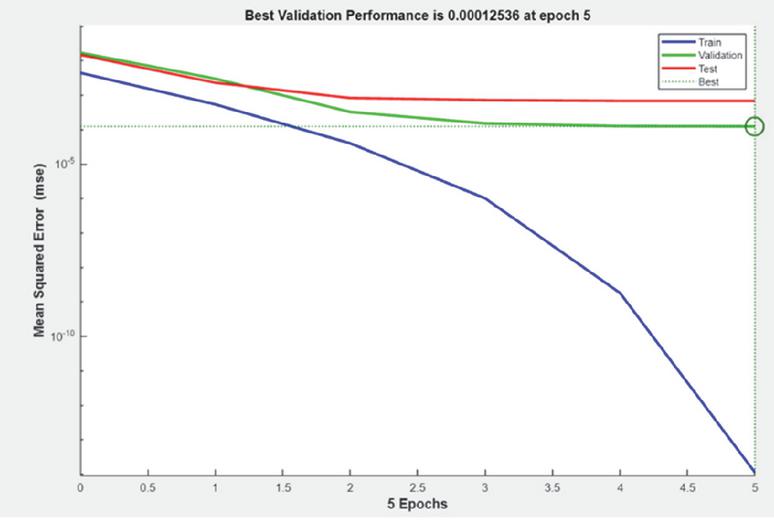
Figure 11 Resistance performance graph.
Figure 10 provides the regression graph that visualises the relationship between the predicted wear resistance (output) and the actual wear resistance (target) for different model training sets. The model demonstrates excellent performance on the training, validation, and test sets, indicating its ability to learn the underlying patterns in the data and generalise well to new, unseen data. The near-perfect R-values suggest that the model captures the relationship between the input features and wear resistance very accurately.
Figure 11 illustrates the performance of an Artificial Neural Network (ANN) model trained to predict wear resistance based on various printing parameters. The key metric used to assess the model’s performance is Mean Squared Error (MSE). The training and validation MSEs decrease rapidly during the initial epochs, indicating that the model is learning quickly. The model’s performance at this point is a good balance between fitting the training data and generalising it to new data.
3.3 Result Analysis Using Genetic Algorithm
A. Decision Variables
x1 Printing Speed (mm/s)
x2 Printing Temperature (∘C)
x3 Layer Height (mm)
B. Empirical Objective Functions (Second-Order Regression Model) B.1. Surface Roughness (Minimize)
B.2 Shear Strength (Maximize)
B.3 Wear Resistance (Minimize)
C. General Polynomial Form
D. Multi-Objective Optimization Model
E. Constraints
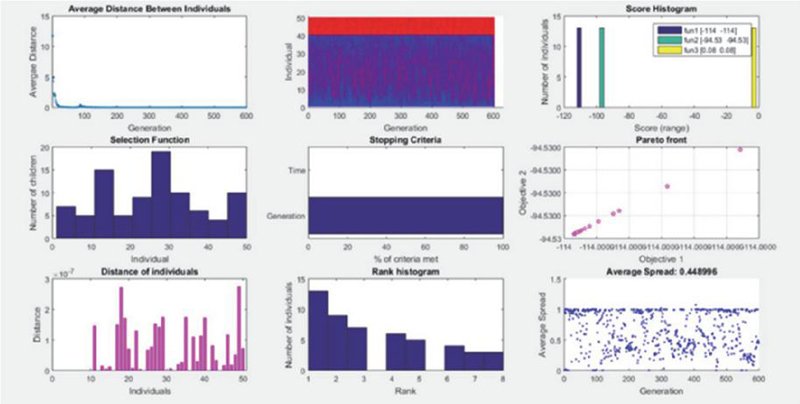
Figure 12 Plot function for GA.
A multi-objective optimisation is carried out using GA so that three contradictory objectives, i.e. minimum Surface roughness, maximum shear strength and minimum wear resistance satisfied simultaneously. Figure 12 shows the results of a multi-objective optimisation using a Genetic Algorithm (GA) for the three responses: minimum surface roughness, maximum shear strength, and minimum wear resistance. From the graph, the Average Distance Between Individuals (Top Left) shows how similar or diverse the individuals (solutions) are across generations. The sharp drop suggests rapid convergence, meaning solutions quickly become similar to one another. Population Evolution (Top Centre) tracks individuals across generations. The red and blue lines indicate changes in population and potential mutations or crossovers. The dense shifts suggest active exploration and exploitation of the solution space. Score Histogram (Top Right) represents the distribution of objective function values. The three coloured bars indicate the range of values for surface roughness (fun1), shear strength (fun2), and wear resistance (fun3). A narrow spread for some objectives hints at quick optimisation. The Selection Function (Middle Left) shows the number of offspring produced by different individuals, indicating how often certain individuals are chosen for reproduction. Higher offspring counts show more “fit” individuals dominating selection. Stopping Criteria (Middle Centre) is a flat graph that implies the stopping condition (likely based on generation count or convergence) was met before criteria like improvement threshold were fully satisfied. Pareto Front (Middle Right) is a crucial plot in multi-objective optimisation. It shows the trade-off between Objective 1 (like surface roughness) and Objective 2 (like shear strength). Points on this curve represent optimal solutions where improving one objective would worsen another. Distance of Individuals (Bottom Left) Measures how spread out the solutions are in the solution space. Higher spikes show some outliers, but most solutions stay closely packed. The Rank Histogram (Bottom Centre) is a distribution of ranks among individuals. Lower ranks likely indicate better solutions, and most individuals are clustered in the lower ranks, suggesting good performance overall. Average Spread (Bottom Right) tracks diversity in the population over generations. A spread around 0.448 suggests that even while the population converges, some diversity is retained, which helps avoid local optima.
The GA successfully balances minimising surface roughness and wear resistance while maximising shear strength. The Pareto front shows the best trade-offs between these objectives, and the quick convergence with retained diversity ensures both efficiency and quality in finding optimal parameter combinations. The parametric combinations obtained are a Printing Speed of 30 mm/s, a printing temperature of 230∘C and of 0.1 mm layer height where a Shear Strength of 114 MPa, Surface roughness of 94 m, and wear resistance of 0.08.
4 Discussion
ANOVA is utilised to identify the lowest Surface Roughness with PLA at 70 mm/s, 210∘C printing temperature, and 0.3 mm layer height. At a printing speed of 30 mm/s, printing temperature of 230∘C, and layer height of 0.1 mm, nylon has the highest shear strength. At a printing speed of 70 mm/s, printing temperature of 190∘C, and layer height of 0.3 mm, nylon has the highest wear resistance. Regression plots are used to illustrate the relationship between the target surface roughness and expected surface roughness (output) for different model training sets by ANN. Regression graphs of Artificial Neural Network (ANN) modelling were used to predict the Shear Strength response of 3d-printed materials (PLA, ABS, and nylon) under different process parameters (Printing Speed, Printing Temperature, Layer Height). The high R-value (0.99687) confirms that the ANN model suits the training data well. This implies that the inherent relationship between process parameters and the Shear Strength response has been well represented by the model. The overall R-value of 0.91182 shows that the model is highly predictive. For various model training sets, the regression graph shows the correlation between the expected wear resistance (output) and the actual wear resistance (target). The model performs exceptionally well on the test, validation, and training sets, demonstrating its capacity to identify underlying patterns in the data and to generalise effectively to previously unseen data. The model appears to accurately represent the link between wear resistance and input variables, as indicated by the nearly perfect R-values. To simultaneously satisfy three conflicting objectives – minimal surface roughness, maximum shear strength, and minimum wear resistance – a multi-objective optimisation is performed using GA. The resulting parametric combinations are 30 mm/s printing speed, 230∘C printing temperature, and 0.1 mm layer height, with 114 MPa shear strength, 94 m surface roughness, and 0.08 wear resistance. The validation of the predicted result has been shown in the Table 2 which shows that the predicted values and experimental results have a deviation less than 10%.
Table 2 Validation of the predicted result
| Response Parameter | Predicted Value | Experimental Value | % Deviation |
| Shear Strength (MPa) | 114 | 108 | 5.26% |
| Surface Roughness (m) | 94 | 101 | 7.45% |
| Wear Resistance | 0.08 | 0.085 | 6.25% |
5 Conclusion
The behaviour of three widely used 3d printing materials – PLA, ABS, and nylon – is studied in the FDM method in this research. The influences of other control parameters on surface roughness, compressive strength, and wear resistance are explored. The parameters considered are printing speed, temperature, and layer height. With the L9 orthogonal array and a well-planned experimental procedure, ANOVA is employed to determine significant process parameters. S/N ratio charts and regression analysis are utilised to investigate the influence of multiple parameters. An Artificial Neural Network is trained with response data, and a Genetic Algorithm is utilised to produce a unique set of parametric combinations. This set of inputs can be used for further optimisation of other functions like machining cost, and therefore can act as a backbone of adaptive control strategies.
References
[1] Ford, S., and Despeisse, M. 2016. Additive manufacturing and sustainability: an exploratory study of the advantages and challenges. Journal of Cleaner Production, 137, 1573–1587.
[2] Taha, I., and Ebeid, S. J. 2016. Mechanical behaviour of ABS: An experimental study using FDM and injection moulding techniques. Journal of Manufacturing Processes, 21, 39–45.
[3] Frazier, W. A. 2014. Metal Additive Manufacturing: A Review. Journal of Materials Engineering and Performance, 23(6), 1917–1928.
[4] Gao, W., Zhang, Y., Ramanujan, D., Ramani, K., Chen, Y., Williams, C., Wang, C. C. L., Shin, Y. C., Zhang, S., and Zavattieri, P. D. 2015. The status, challenges, and future of additive manufacturing in engineering. Computer-Aided Design, 69, 65–89.
[5] Gibson, I., Rosen, D. W., and Stucker, B. 2010. Additive Manufacturing Technologies. In Springer eBooks.
[6] Gu, D., Meiners, W., Wissenbach, K., and Poprawe, R. 2012. Laser additive manufacturing of metallic components: materials, processes and mechanisms. International Materials Reviews, 57(3), 133–164.
[7] Guo, N., and Leu, M. 2013. Additive manufacturing: technology, applications and research needs. Frontiers of Mechanical Engineering, 8(3), 215–243.
[8] Herzog, D., Seyda, V., Wycisk, E., and Emmelmann, C. 2016. Additive manufacturing of metals. Acta Materialia, 117, 371–392.
[9] Hopkinson, N., and Dickens, P. 2003. Analysis of rapid manufacturing – using layer manufacturing processes for production. Proceedings of the Institution of Mechanical Engineers, Part C: Journal of Mechanical Engineering Science, 217(1), 31–39.
[10] Kruth, J., Leu, M., and Nakagawa, T. 1998. Progress in Additive Manufacturing and Rapid Prototyping. CIRP Annals, 47(2), 525–540.
[11] Lewandowski, J. J., and Seifi, M. 2016. Metal Additive Manufacturing: A Review of Mechanical Properties. Annual Review of Materials Research, 46(1), 151–186.
[12] Ligon, S. C., Liska, R., Stampfl, J., Gurr, M., and Mülhaupt, R. 2017. Polymers for 3d Printing and Customised Additive Manufacturing. Chemical Reviews, 117(15), 10212–10290.
[13] Masood, S. H., and Song, W. 2005. Thermal characteristics of a new metal/polymer material for FDM rapid prototyping process. Assembly Automation, 25(4), 309–315.
[14] Melchels, F. P., Domingos, M., Klein, T. J., Malda, J., Da Silva Bartolo, P. J., and Hutmacher, D. W. 2012. Additive manufacturing of tissues and organs. Progress in Polymer Science, 37(8), 1079–1104.
[15] Ngo, T., Kashani, A., Imbalzano, G., Nguyen, K., and Hui, D. S. 2018. Additive manufacturing (3d printing): A review of materials, methods, applications and challenges. Composites Part B-engineering, 143, 172–196.
[16] Nikzad, M., Masood, S. H., and Sbarski, I. 2011. Thermo-mechanical properties of highly filled polymeric composites for Fused Deposition Modelling. Materials in Engineering, 32(6), 3448–3456.
[17] Sames, W. J., List, F. A., Pannala, S., Dehoff, R. R., and Babu, S. S. 2016. The metallurgy and processing science of metal additive manufacturing. International Materials Reviews, 61(5), 315–360.
[18] Shanmugam, V., Haarith, D., Babu, K., Rajendran, S., Veerasimman, A., Marimuthu, U., Singh, S., Das, O., Khorasani, S. N., Hedenqvist, M. S., Berto, F., and Ramakrishna, S. 2021. The mechanical testing and performance analysis of polymer-fibre composites prepared through additive manufacturing. Polymer Testing, 93, 106925.
[19] Singamneni, S., Roychoudhury, A., Diegel, O., and Huang, B. 2012. Modelling and evaluation of curved layer fused deposition. Journal of Materials Processing Technology, 212(1), 27–35.
[20] Thompson, M. E., Moroni, G., Vaneker, T. H., Fadel, G. M., Campbell, R. I., Gibson, I., Bernard, A., Schulz, J., Graf, P., Ahuja, B., and Martina, F. 2016. Design for Additive Manufacturing: Trends, opportunities, considerations, and constraints. CIRP Annals, 65(2), 737–760.
[21] Wang, X., Xu, S., Zhou, S., Xu, W., Leary, M., Choong, P. F. M., Qian, M., Brandt, M., and Xie, Y. 2016. Topological design and additive manufacturing of porous metals for bone scaffolds and orthopaedic implants: A review. Biomaterials, 83, 127–141.
[22] Wang, Y., Voisin, T., McKeown, J. T., Ye, J., Calta, N. P., Li, Z., Zeng, Z., Zhang, Y., Chen, W., Roehling, T. T., Ott, R. T., Santala, M. K., Depond, P. J., Matthews, M. J., Hamza, A. V., and Zhu, T. 2018. Additively manufactured hierarchical stainless steels with high strength and ductility. Nature Materials, 17(1), 63–71.
[23] Williams, S. W., Martina, F., Addison, A. C., Ding, J., Pardal, G., and Colegrove, P. A. 2016. Wire + Arc Additive Manufacturing. Materials Science and Technology, 32(7), 641–647.
[24] Wong, K. V., and Hernandez, A. M. P. 2012. A Review of Additive Manufacturing. ISRN Mechanical Engineering (Print), 2012, 1–10.
Biographies

Pritam Pain is an Assistant Professor in the Department of Mechanical Engineering at Haldia Institute of Technology, India. He received his B.Tech and M.Tech degrees in Mechanical Engineering and is currently pursuing his Ph.D. in Non-Traditional Manufacturing Processes. His research interests include non-conventional and micro-machining processes (EDM, WEDM, -EDM), parametric and multi-objective optimization, and the application of metaheuristic and soft-computing techniques in advanced manufacturing. He has published several research articles and book chapters in reputed international journals and edited volumes.

Goutam Kumar Bose is a Professor and Head of the Department of Mechanical Engineering at Haldia Institute of Technology, India, with over 25 years of academic and industrial experience. He holds a Ph.D. in Production Engineering from Jadavpur University. His research interests include advanced and non-conventional manufacturing processes, production management, tribology, and micro-scale manufacturing. He has led and contributed to several sponsored research projects funded by CSIR and AICTE and has co-authored multiple books published by leading international publishers.

Bipradas Bairagi is an academician in the Department of Mechanical Engineering at Haldia Institute of Technology, India. He holds a doctoral degree in Mechanical Engineering and has several years of teaching and research experience. His research interests include manufacturing processes, advanced machining, and related areas of mechanical engineering. He has published research articles in reputed journals and conferences and is actively involved in academic and research activities.
Journal of Graphic Era University, Vol. 14_1, 305–326
doi: 10.13052/jgeu0975-1416.14110
© 2026 River Publishers