Reliability Analysis of an Elevator System Under Resume Repair Policy
Shristi Kharola1, Mangey Ram2 and Shivani Singh3,*
1Department of Mathematics, Graphic Era (Deemed to be University), Dehradun, Uttarakhand, India
2Department of Mathematics & Computer Science Engineering, Graphic Era (Deemed to be University), Dehradun, Uttarakhand, India
3Department of Applied Science and Humanities, Roorkee Institute of Technology, Roorkee, India
E-mail: shristikharola@gmail.com; mangeyram@gmail.com; shivanishanu14@gmail.com
*Corresponding Author
Received 08 October 2025; Accepted 12 January 2026
Abstract
In day-to-day life, elevators and lift systems have become essential for one’s daily operations. It is therefore important to guarantee its reliability and efficiently prioritise repairs of any kind. In this study, for an elevator system, two types of failures are considered. The first is the critical failure of the elevator brought on either by a power issue or mechanical wear. The second is the non-critical failure caused by minor electrical failures like lighting system failure. Since electrical or lighting failures can be temporarily controlled, the critical failure is given priority in system repairs. This study shows how the preemptive resume repair model can be applied to the general maintenance of an elevator system. The primary objective of this study is to assess the reliability parameters under the resume repair policy.
Keywords: Reliability, priority repair, mean time to failure (MTTF), resume repair, availability.
1 Introduction
As the global population has risen in recent years, urbanization has accelerated and the need for simple conveniences has risen, also leading to an increased use of elevators and escalator systems. The use of elevators has become common both residentially and commercially. Therefore, innovative designs and awareness of safety measures have become essential. At all costs, an elevator’s ability to carry the combined weight of multiple passengers must be guaranteed (Yao et al., 2022). An elevator system is a vertical transportation technology that moves a car (or lift) between levels of a building using a combination of cables, pulleys, and counterweights. It is usually driven by electric motors. Currently, an elevator’s safety is primarily dependent on its routine maintenance and the concerned agency’s routine inspection.
The increasing danger of serious injuries associated with elevators is not widely recognised. Accidents with elevators happen more often and cause more severe injuries than is often thought. With nearly 900,000 elevators in operation across the United States, serving both commercial and residential buildings, they collectively make around 18 billion trips annually. Despite advancements in mechanical systems and safety protocols, elevators continue to cause thousands of injuries each year. Reports indicate that, on average, 27 fatalities occur annually due to elevator-related accidents, while more than 10,200 individuals sustain injuries. Over half of these fatalities result from falls into the elevator shaft, while approximately 17% involve workers performing maintenance or repairs. Additionally, around 30% of fatal incidents take place during the elevator’s operation (Lytal et al., 2023).
Considering there are so many elevators and not enough maintenance managers, elevator users, supervisory departments and maintenance department must work together to address the issue of how to identify elevator breakdowns quickly and take appropriate action to address them (Huang et al., 2020). Innovation in technology is essential for enhancing elevator reliability and performance in a number of ways for operational continuity, efficiency, and safety. While it guarantees stable performance, safety, cost effectiveness, and trust, reliability is essential in engineering, business, and daily life. For buildings, particularly high-rise ones, to operate safely, effectively, and continuously, elevator systems must be reliable. A robust elevator system enhances user experience, minimises delay, and reduces errors. A crucial component of an elevator reliability management is priority repair, which guarantees that important malfunctions are fixed right away to save downtime, improving safety, and maximising efficiency (Yuan and Meng, 2011).
In this study, the authors assume a priority repair strategy as a mathematical model for the reliability evaluation of an elevator system. This means that when several components fail, certain components are repaired with greater urgency than others. This is because certain faults in an elevator system – like power issues or mechanical wear – are more critical for the system than other faults – like lighting faults due to electrical failures.
To reduce downtime, a priority repair policy makes sure that the required parts are repaired first. Resume repair is the process of continuing a repair from where it left off, rather than beginning over, in the event that a more severe failure interrupts the repair. This simulates actual maintenance situations in which professionals must move on to more urgent issues while retaining the work completed on less urgent ones. By working on the critical failure first, priority repair maximises the elevator system’s total availability while ensuring that it continues to function as effectively as possible, even if some non-critical components are still undergoing repair. Hence, the term Preemptive-resume (Pres) is used throughout the text which states that- The unit with higher priority is repaired first, while the lower-priority unit is repaired afterward. When the lower-priority unit returns to the repair facility, its repair process continues from the point where it was previously halted (Singh and Ayagi, 2018).
Preemptive resume repair (P-res) is a commonly recognized and successful approach for repairable systems especially where immediate and urgent repair is necessary (Singh and Ayagi, 2018). The P-res policy allows immediate interruption of a lower-priority repair to jump to higher-priority failure. This demonstrates effective repair techniques in safety-critical systems where the immediate repair of certain components is required to prevent system downtime. Whereas compared to non-preemptive (head-of-line) repair policies, repair follows a first-come, first-service policy. Likewise, preemptive-repeat repair policy requires halted repairs to restart from the beginning, resulting in increased downtime and cost. The P-res policy says that the repair that was interrupted in between can be started from the point where it was interrupted, as some repair effort is not always lost.
Due to its substantial influence on system performance and availability, resume repair – especially under preemptive priority disciplines – has been extensively researched in reliability engineering. Chopra (2023) analyzed a 2-out-of-3: G system where repair followed a preemptive priority resume discipline. Failures were modelled using an exponential distribution, while repairs followed a general distribution. They formulated differential equations using the supplementary variable method and solved them through Laplace Transformations. The study assessed how different repair priorities influenced availability, reliability, MTTF, and expected profit. Singh and Ayagi (2018) studied a complex system consisting of three units – super priority, priority, and ordinary – under a preemptive resume repair policy. The system was controlled by a human operator and an automatic changeover switch, with additional failure modes such as deliberate failure and switch failure.
Two reliability models were created by Chander and Bhardwaj (2009) for a 2-out-of-3 redundant system that consisted of two original units and one cold standby duplicate unit. As long as any two components operated simultaneously, the system continued to function. When the first unit failed, it was investigated to see if it could be repaired, and the duplicate was fixed without being examined. In the second model, repair of the original unit was given priority over the duplicate unit. The authors generated mean time to system failure and profit expressions using the semi-Markov process and regenerative point technique. Goyal et al. (2009) developed a mathematical model for a Rubber Preparation System in a rubber tube manufacturing plant to enhance its availability. The study of the system was based on Markov modelling and it functioned under a preemptive resume priority repair discipline. Transitions from pending-to-failed to failed states were examined using preventive maintenance (PM) and corrective maintenance (CM), respectively. To optimise performance, the effect of PM repair faults on critical components was investigated. In order to get state probabilities, differential equations derived from probability considerations were solved using the Laplace Transform, with failure and repair rates assumed to be constant. Important elements influencing system availability were found by performance analysis. The performance analysis identified critical factors affecting system availability.
A two-subsystem system with a hot standby unit that included two repairmen – a supervisor and a novice (who takes vacations) – was studied by Tiwari and Singh (2015). The authors used Copula, Laplace transforms, and supplementary variable technique to study the system under a preemptive-resume-repair discipline. Reliability, availability, cost analysis, and steady-state behaviour were among the performance metrics that were assessed. With the use of numerical examples, they did a comparative analysis of head-of-line repair vs preemptive resume repair techniques and compared the outcomes using Gumbel-Hougaard and Bivariate Clayton Copulas. Gao et al. (2025) analysed reliability and queueing performance using Laplace transform inversion (Stehfest method) for approximate reliability solutions and sequential quadratic programming to optimize repair cost-benefit balance. Authors proposed a preemptive priority repair policy for a circular consecutive-k-out-of-n: F system, where failed components are assigned either emergency repair (if their failure causes system breakdown) or ordinary repair (if they do not). Ordinary failures are queued in an “orbit” and repaired on a first-failed-first-repair basis when the repairman is idle, but emergency repairs take precedence. The findings are demonstrated in a Cir/Con/2/6: F system.
In this study, authors analyze the reliability of an elevator system under a preemptive resume repair policy. The system is considered to undergo two types of failures: critical and non-critical failures. Failures follow an exponential distribution, while repairs follow a general distribution. Using the supplementary variable technique and Laplace transform, the system’s differential equations are formed. Reliability performance metrics- availability, reliability, MTTF, and expected profit are evaluated. To model the priority repair policy mathematically, state probabilities are defined by Markov processes and stochastic methods. The remainder of the paper is organized as follows: Section 2 describes the model in detail, followed by notations, assumptions and reliability state transition diagram. Section 3 covers the derivation of the Markov model state equations. Section 4 presents the numerical analysis of reliability parameters. Section 5 provides a detailed result analysis followed by conclusion in Section 6.
2 Model Description
An elevator system serves as a vital infrastructural component in buildings, facilitating the efficient vertical transportation of individuals and goods. The system comprises of several critical systems, including the motor-drive system, braking system, control system, doors and sensors, power supply; and non-critical systems such as lighting, ventilation, and communication mechanisms. In reliability analysis, a priority repair strategy is implemented to optimize maintenance and minimize downtime when multiple systems experience failure. Under this approach, failures of critical systems (e.g., power system, motor, or braking mechanism), which directly impact system functionality, are addressed with higher urgency. In contrast, failures of non-critical systems (e.g., lighting system malfunctions or minor sensor faults) are deferred until the restoration of critical components is completed.
Initially, both critical and non-critical systems operate at full efficiency, with the system considered in a fully functional state. Over time, non-critical components deteriorate and fail, initiating repair activities. Subsequently, the failure of a critical subsystem results in a complete system breakdown. At this stage, a preemptive resume repair policy is employed, wherein the repair of the critical subsystem takes precedence over any ongoing non-critical repairs. The maintenance process for non-critical failures is temporarily suspended, allocating all available repair resources to restore the critical system and reinstate elevator functionality at the earliest. When the critical subsystem is repaired, then the preempted non-critical system is resumed to repair from the stage where it was previously interrupted.
The mathematical calculations in this study are based on the following notations and assumptions:
2.1 Notations
The following notations have been used throughout the article.
| s | Laplace transform variable |
| t | Time variable |
| -System states | Probability that the system is in state j at time t; for j 0,1,2,3 |
| j 0; none of the units are failed | |
| j 1; the non-critical system has failed partially with the critical system functioning perfectly | |
| j 2; the critical system has failed completely hence entire system fails | |
| j 3; both systems have failed hence entire system fails | |
| Probability density function that at time t, due to a failure, the system at state j, is under elapsed repair time r; r x, y | |
| PDF at time t, for state j, considers elapsed repair times x and y () ensuring that unit B cannot fail during unit A’s repair | |
| Failure rate | |
| i A; for the critical system | |
| i B; for the non-critical system | |
| Repair rate | |
| k A, r x; repair of degradation or failure for the critical system. | |
| k B, r y; repair of degradation or failure for the non-critical system. | |
| revenue per unit time | |
| service cost per unit time |
2.2 Assumptions for the Model
Compared to the state transition diagrams in Figure 1, the following assumptions apply to the priority repair model.
(a) Initially, the system is in a fully functional state.
(b) The critical system experiences failures at a constant rate and has two states: good and failed.
(c) The non-critical system can exist in three states: good, deteriorated, or failed.
(d) A failed system is detected and repaired immediately, restoring it to a like-new condition without causing any damage.
(e) The joint-probability-distribution of repair-rates from state to and to follows the Gumbel-Hougaard copula family.
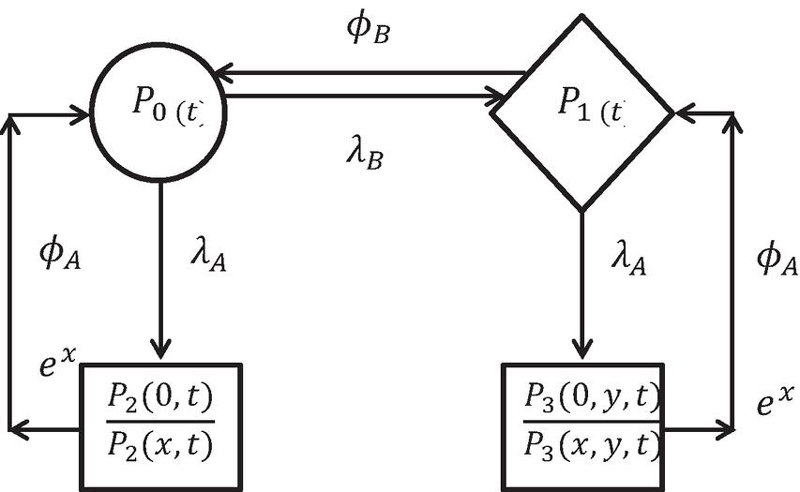
Figure 1 STD of Preemptive-resume repair policy.
The state-transition diagram (STD) illustrating the system’s stochastic behaviour under failures and repairs for the considered repair policy is shown in Figure 1. Failure rates have been assumed as constants implying failure time to follow an exponential distribution, while repairs were modelled using a general (arbitrary) distribution for partially failed states and the Gumbel-Hougaard family copula for completely failed states. These analyzed the system using the supplementary variable technique and Laplace transform, evaluating availability, reliability, MTTF, and profit function.
The states and probabilities of each state depicted in Figure 1 are further modelled mathematically in Sections 3 by the application of Markov model state equations.
3 Markov Model-State Equations
Markov model-based reliability analysis is a methodological approach used to evaluate system states and their transitions over time. The system operates in either a good state, a degraded state, or a failure state. A failure occurring in one module may propagate, leading to an entire system failure. A fundamental assumption of the Markov model is that the future state of a module is dependent solely on its current state, with the probability of transitioning to the next state determined exclusively by the system’s present condition. This property is widely known as the Markov process (Jo et al., 2024). The supplementary variable method enhances the Markovian process by introducing one or more continuous variables into the state space. As a result, the process becomes a Continuous State Space and Continuous Time Markov process.
Copulas enable joint distributions when only marginal distributions are known with certainty (Fang et al., 2020). A d-dimensional copula is a distribution function with standard uniform marginal distributions on [0, 1]. Let represent copula distribution functions. Thus, maps the unit hypercube, onto the unit interval as : . The following properties must hold:
(i) is increasing in each component .
(ii) and .
(iii) and in with .
The Bivariate Gumbel–Hougaard family copula is given by:
where, , and , is a parameter. For , the Gumbel–Hougaard copula represents independence; while as , it converges to comonotonicity (Gahlot et al., 2020).
3.1 Mathematical Model
Let represent the probability that at time t (state 0) there is no priority system and all components are operational. Let denote the probability that at time t (state 1) the non-priority system is partially functional and undergoing repair. Let be the probability that at time (state 2) the priority system has failed and is under repair. Let represent the probability that at time t (state 3) both systems have failed. In this state, the repair of the critical system (A) takes priority, while the repair of the non-priority system (B) is preempted. Once the critical system’s repair is complete, the repair of the non-critical system resumes from where it was previously interrupted. Thus, in the preemptive resume scenario, the priority system is repaired first, followed by the continuation of the non-priority system’s repair from the point of preemption. Also, the quantities in the following Equations are probabilistic, hence they do not have any dimensions.
Mathematical model:
| (1) | |
| (2) | |
| (3) | |
| (4) |
With Boundary conditions:
| (5) | |
| (6) |
Initially, it is assumed that all components are in a fully operational state. Therefore, the initial condition is given by:
while the probabilities of all other states are zero at t 0, i.e.,
| (7) |
Let the Laplace transform of be denoted as .
Solution of the model by taking Laplace transformations of the above formed equations,
| (8) | |
| (9) | |
| (10) | |
| (11) |
With Boundary conditions:
| (12) | |
| (13) |
By solving these equations, the state probabilities are determined as follows:
| (14) | |
| (15) | |
| (16) | |
| (17) |
where,
| (18) | |
| (19) | |
| (20) |
Evaluating and :
| (21) | |
| (22) |
4 Reliability Assessment
4.1 Reliability and Availability Comparison
A system is considered reliable if it functions without failure for a specified period. Consequently, by setting all repair terms to zero and applying the inverse Laplace transform to the upstate probability, the system’s reliability can be determined. Equation (21) calculates the system reliability with values of various failure rates taken as, , , and . In this study, the numerical values are scenario-specific and illustrative. Thus, the final equation is derived as:
| (23) |
After the first failure and repair, the probability that a system will be available in a certain condition for a specific period, for which it remains operational, is defined as system availability. On taking the values of failure rates as, , , and , in Equation (21) and applying the Laplace transform to retrieve the time-domain solutions for state probabilities, the final availability equation is obtained as:
| (24) |
Setting the time-period t from 0 to 10, the reliability and availability of the system is compared as shown in Table 1.
Table 1 Reliability and availability comparison
| Time | Reliability (Before Repair) | Availability (After Repair) |
| 0 | 1.0000000000 | 0.9999999999 |
| 1 | 0.9512294245 | 0.9830306480 |
| 2 | 0.9048374180 | 0.9819566277 |
| 3 | 0.8607079764 | 0.9818886511 |
| 4 | 0.8187307531 | 0.9818843487 |
| 5 | 0.7788007830 | 0.9818840764 |
| 6 | 0.7408182207 | 0.9818840592 |
| 7 | 0.7046880897 | 0.9818840581 |
| 8 | 0.6703200460 | 0.9818840580 |
| 9 | 0.6376281516 | 0.9818840580 |
| 10 | 0.6065306596 | 0.9818840580 |
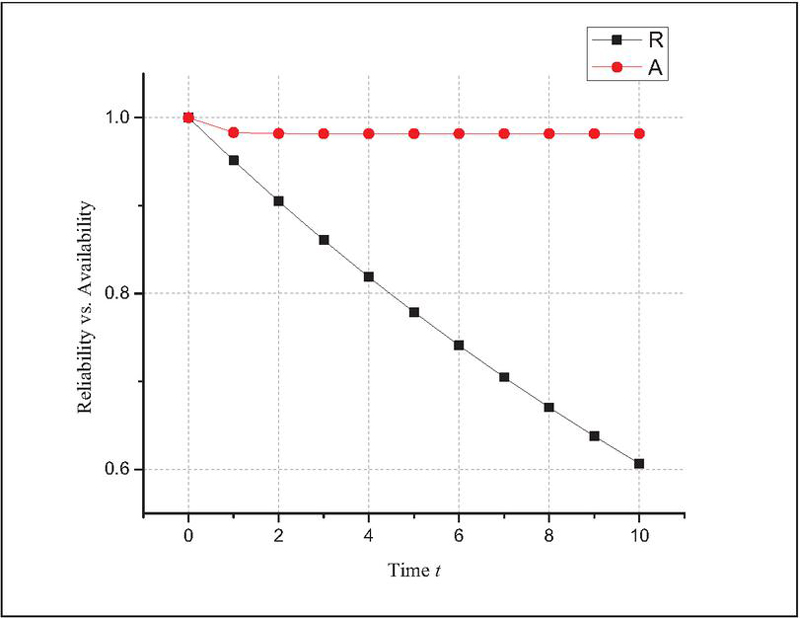
Figure 2 Time graph of reliability vs. availability.
4.2 MTTF
MTTF is the average amount of time that a non-repairable asset operates before failing. By setting , c 0 and , in the upstate Equation (21), the MTTF is evaluated by varying between 0.1 and 0.9. Similarly, with , c 0 and the MTTF of the non-critical system is evaluated by varying between 0.1 and 0.9. The resulting MTTF values are presented in Table 2.
Table 2 MTTF
| Variation in Values of | MTTF | Variation in Values of | MTTF |
| 0.01 | 10.00000000 | 0.01 | 20.00000000 |
| 0.02 | 5.000000000 | 0.02 | 20.00000000 |
| 0.03 | 3.333333334 | 0.03 | 20.00000000 |
| 0.04 | 2.500000000 | 0.04 | 20.00000000 |
| 0.05 | 2.000000000 | 0.05 | 20.00000000 |
| 0.06 | 1.666666667 | 0.06 | 20.00000000 |
| 0.07 | 1.428571429 | 0.07 | 20.00000000 |
| 0.08 | 1.250000000 | 0.08 | 20.00000000 |
| 0.09 | 1.111111111 | 0.09 | 20.00000000 |
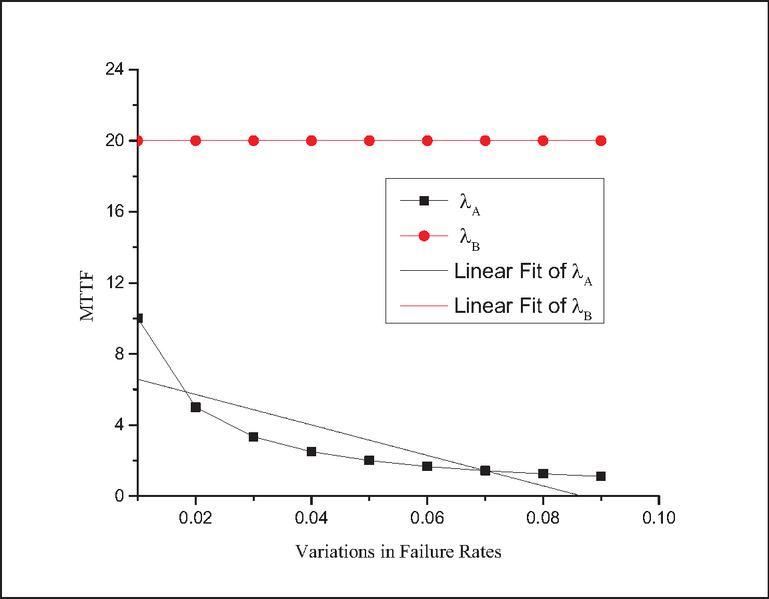
Figure 3 MTTF of the system with respect to each failure rate.
4.3 Cost Analysis-Expected Cost ()
If the service facility is always available, then expected profit during the time interval [0, t) is given by the formula with and .
| (25) |
The for the interval [0, t) is determined using the following equation:
| (26) |
On using, & , 0.2, 0.3, 0.4, 0.9 respectively in Equation (4.3), we get Table 3.
Table 3 Expected cost ()
| Time (t) | |||||
| 0 | 0 | 0 | 0 | 0 | 0 |
| 1 | 0.8880323739 | 0.7880323739 | 0.6880323739 | 0.5880323739 | 0.088032373 |
| 2 | 1.770305570 | 1.570305570 | 1.370305570 | 1.170305570 | 0.170305570 |
| 3 | 2.652214257 | 2.352214257 | 2.052214257 | 1.752214257 | 0.252214257 |
| 4 | 3.534099874 | 3.134099874 | 2.734099874 | 2.334099874 | 0.334099874 |
| 5 | 4.415984030 | 3.915984030 | 3.415984030 | 2.915984030 | 0.415984030 |
| 6 | 5.297868095 | 4.697868095 | 4.097868095 | 3.497868095 | 0.497868095 |
| 7 | 6.179752153 | 5.479752153 | 4.779752153 | 4.079752153 | 0.579752153 |
| 8 | 7.061636211 | 6.261636211 | 5.461636211 | 4.661636211 | 0.661636211 |
| 9 | 7.943520269 | 7.043520269 | 6.143520269 | 5.243520269 | 0.743520269 |
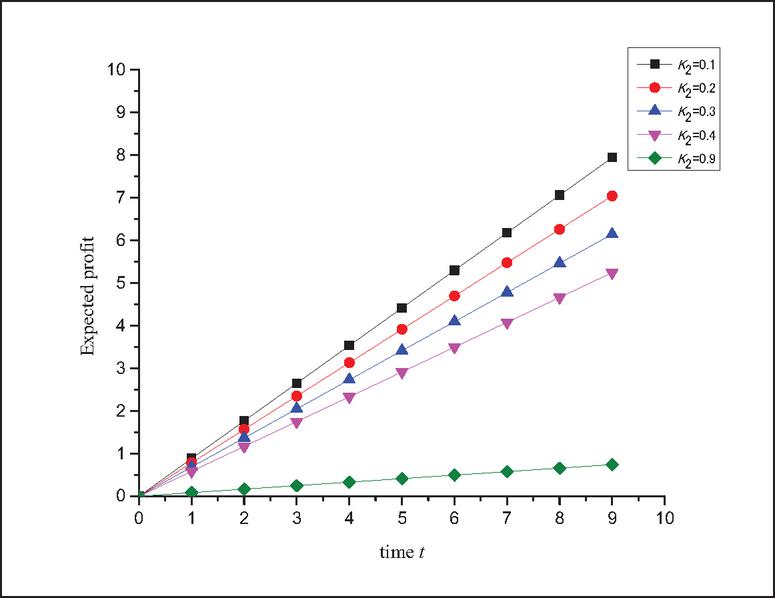
Figure 4 Profit with time.
5 Result Analysis
Table 1 showed a comparison of reliability and availability over time. The reliability values represent the probability that a system remains operational without failure, while availability reflects the system’s ability to perform its intended function after undergoing repairs. At time , the system starts with a perfect reliability of 1.00. As time progresses, reliability declines exponentially, reaching 0.6065 at . This trend is expected, as reliability typically decreases due to wear, degradation, or increasing failure probability over time. The Availability remains relatively stable. The system starts with an availability close to 1.0000 at . Availability slightly decreases at (0.9830) but stabilizes around 0.9819 from onward. This indicates that repair mechanisms are effective in maintaining a high operational state, preventing drastic declines in availability despite reliability degradation. Table 2 presents the MTTF values for two different failure rate variations: and . The MTTF is a measure of the expected operational time before a failure occurs. It is observed that increases from 0.01 to 0.09, the MTTF decreases accordingly. At , the system has an MTTF of 10.0000, meaning it is expected to operate for 10-time units before failure. When increases to 0.09, the MTTF drops to 1.1111, indicating that a higher failure rate leads to a shorter operational time before failure. This follows the inverse relationship between failure rate and MTTF, as . Regardless of the increasing values of (from 0.01 to 0.09), the MTTF remains constant at 20.0000. This suggests that the failure mechanism governing is different from that of , this is due to external maintenance or redundancy strategies maintaining system stability as is supposed to be the failure rate of non-critical system. has a direct inverse impact on MTTF, meaning an increase in failure rate significantly reduces system reliability. Table 3 presents the Expected profit (Ep) over time t for different values of (service cost per unit time). At , the cost is 0 for all values of , indicating no accumulated expenses at the start as the system reliability is 1. The graph illustrates that as time progresses, the expected profit also increases, indicating the system’s efficient performance under the repair policy. However, a rise in (service cost) results in a decline in system profit, as expected. Examining over an extended period can provide insights into its impact on the system’s overall profitability. Optimizing and is crucial to maximizing long-term profitability while maintaining system reliability.
Maintenance scheduling helps to plan ahead of time and address issues before they arise. The present study has repeatedly focused on the effectiveness of the P-res policy which also largely depends on appropriate scheduling mechanisms. Priority-based modelling is equal to reliable condition monitoring for accurately identifying high-priority components. Every system small or large, has a life span. Once its time is up, it should be updated or replaced. Therefore, it is necessary to have a robust maintenance policy as one can repair it immediately if there is any issue. Planned maintenance lets engineers renovate/repair systems, helping largely in cases where equipment breaks down unexpectedly. With the growing use of sensor-based monitoring systems and automated maintenance management platforms in current workplaces, the proposed repair technique is both feasible and practicable.
6 Conclusion
The study calculates the reliability, availability, MTTF (mean-time-to-failure) and expected cost of an elevator system, considering failure rates and a priority repair strategy. The preemptive-resume repair technique indicates the accessibility of effective condition monitoring for immediate identification of defects, priority-based maintenance scheduling, and sufficient maintenance documentation to allow interrupted repair processes to be restarted. The findings indicate that while elevator reliability decreases over time, regular maintenance and timely repairs help sustain high availability. The expected cost analysis highlights the impact of service cost on overall expenses, showing that optimized maintenance strategies can significantly reduce long-term financial costs. By balancing revenue per unit time and service costs , elevator operators can enhance system performance, minimize downtime, and improve safety. These insights contribute to the development of more efficient and cost-effective maintenance policies for elevator systems. Future research can explore optimized maintenance strategies, considering detection delays and imperfect repairs. Also failures with communication system and sensors that trigger safety shutdowns in modern elevators can be considered. The model can be extended to non-exponential lifetimes in future work. Predictive modelling techniques, incorporating machine learning, can be integrated to improve failure prediction and cost estimation.
Acknowledgement
The authors express their gratitude to Graphic Era (Deemed to be University), Dehradun, Uttarakhand, India, for their support. This article has been prepared in good faith based on the information available at the time of publication.
Compliance with Ethical Standards
The authors declare no conflict of interest. This study is based on secondary data obtained from publicly available sources. No human participants or animals were involved, and hence ethical approval was not required.
References
Yao, W., Jagota, V., Kumar, R., Ather, D., Jain, V., Quraishi, S. J., and Osei-Owusu, J. (2022). Study and application of an elevator failure monitoring system based on the internet of things technology. Scientific Programming, 2022(1), 2517077.
Huang, Q., Cao, J., and Sun, R. (2020, August). Design and implementation of an elevator power failure warning system. In Journal of Physics: Conference Series, 1621(1), p. 012050. IOP Publishing.
Yuan, L., and Meng, X. Y. (2011). Reliability analysis of a warm standby repairable system with priority in use. Applied Mathematical Modelling, 35(9), 4295–4303.
Chopra, G. (2023). Stochastic Model for Linear Consecutive 2-out-of-3: G System with Pre-emptive Priority Resume Repair. International Journal of Mathematics Trends and Technology, 69.
Singh, V. V., and Ayagi, H. I. (2018). Stochastic analysis of a complex system under preemptive resume repair policy using Gumbel-Hougaard family copula. International Journal of Mathematics in Operational Research, 12(2), 273–291.
Chander, S., and Bhardwaj, R. K. (2009). Reliability and economic analysis of 2-out-of-3 redundant system with priority to repair. African J. of Maths and Comp. Sci., 2(11), 230–236.
Goyal, A., Sharma, S. K., and Gupta, P. (2009). Availability analysis of a part of rubber tube production system under preemptive resume priority repair. International Journal of Industrial Engineering, 16(4), 260–269.
Tiwari, N., and Singh, S. B. (2015). Analysis of a risky two unit system under marked process incorporating two repairmen with vacations. Journal of Risk Analysis and Crisis Response, 5(4), 200–214.
Gao, S., Wang, J., and Chen, Q. (2025). Reliability Evaluation for a Circular Con/k/n: F System With a Novel Differential Repair Policy. IEEE Transactions on Reliability.
Jo, J. S., Kim, S. P., Oh, S. G., Kim, T. J., Kang, F. S., and Park, S. J. (2024). Markov model-based reliability analysis considering the redundancy effect of modular converters. IEEE Access, 12, 3328–3338.
Fang, J., Jiang, F., Liu, Y., and Yang, J. (2020). Copula-based Markov process. Insurance: Mathematics and Economics, 91, 166–187.
Gahlot, M., Singh, V. V., Ayagi, H., and Abdullahi, I. (2020). Stochastic analysis of a two units’ complex repairable system with switch and human failure using copula approach. Life Cycle Reliability and Safety Engineering, 9(1), 1–11.
Lytal., Reiter., Smith., lovey., and Fronrath. March 28 (2024). Elevator accidents are more common than you think. For Your Rights. https://www.foryourrights.com/blog/elevator-accidents-are-more-common-than-you-think/.
Singh, V. V., and Ayagi, H. I. (2018). Stochastic analysis of a complex system under preemptive resume repair policy using Gumbel-Hougaard family copula. International Journal of Mathematics in Operational Research, 12(2), 273–291.
Biographies

Shristi Kharola received her Ph.D. in Mathematics from Graphic Era (Deemed to be University), Dehradun, India. Her research interests lie in the areas of Reliability Theory of Engineering, Multi-Criteria Decision-Making (MCDM) techniques, and sustainable systems, with a strong multidisciplinary research orientation. She joined the Department of Mathematics, Graphic Era (Deemed to be University), as an Assistant Professor (Research) in 2023. As of 2025, she has presented her research work at nine international conferences and continues to actively engage in international research dissemination. Dr. Kharola has contributed as a Junior Research Fellow (JRF) in an international collaborative research project on sustainable development involving institutions from India, Turkey, and the United Kingdom, funded by USERC, India. She serves as an Early Career Editorial Board Member of the International Journal of Mathematical, Engineering and Management Sciences. She has published extensively in National and International Journals of her domain.

Mangey Ram is a Professor of Mathematics and Dean (Research Collaborations) at Graphic Era (Deemed to be University), Dehradun, India. He received his Ph.D. in Mathematics (major) with Computer Science (minor) from G. B. Pant University of Agriculture and Technology, Pantnagar, India, in 2008. His research interests include reliability theory, operations research, optimization techniques, and applied mathematics. Prof. Ram has published extensively in reputed international journals and with leading publishers. He serves as Editor-in-Chief and Editorial Board Member of several international journals and is a Series Editor for multiple book series with Elsevier, CRC Press (Taylor & Francis), De Gruyter, and River Publishers. He is a Senior Member of IEEE and a recipient of several prestigious research and academic awards, including the Excellence in Research of the Year Award (2025).

Shivani Singh received her B.Sc. and M.Sc. degree in mathematics from Hemwati Nandan Bahuguna, Garhwal University, Uttarakhand, India in 2016 and 2018. She received her Ph.D. degree in Mathematics from Graphic Era Deemed to be University, Dehradun, India. Earlier, she worked as an Assistant Professor in department of mathematics department at Graphic Era Deemed to be University, Dehradun, India. Currently, she is working as an Assistant Professor in department of applied sciences and humanities at Roorkee Institute of Technology, Roorkee, India. She has published research articles and book chapters with IEEE, EDP Sciences, Cambridge Scientific publishers, CRC press and Taylor and Francis. Her research interests are reliability theory, multi-state systems, Markov process and applied mathematics.
Journal of Graphic Era University, Vol. 14_1, 251–270
doi: 10.13052/jgeu0975-1416.1418
© 2026 River Publishers