Effects of Human Activities from the Indo-Gangetic Plain on the Air Quality in the Foothills of the Himalayas
Nand Kishore1, Bipin Singh Koranga1,* and Atul Kumar Srivastava2
1Kirori Mal College, Department of Physics, Delhi University, New Delhi 110007, India
2Indian Institute of Tropical Meteorology, Ministry of Earth Sciences, New Delhi 110060, India
E-mail:
*Corresponding Author
Received 11 October 2024; Accepted 28 December 2024
Abstract
The relationship between surfaces that measure climatic parameters and the mass concentration of various air pollutants across the Indo-Gangetic Plain (IGP) and Himalayan foothills is investigated using three separate stations. In an industrial area of Delhi, a residential area of Shimla, and a residential area of Hisar, the simultaneous measurement of mass concentrations of air pollutants such as NO2, SO2, RSPM, and SPM, as well as the impact of surface meteorological parameters on their distributions, are investigated for the study period of January 2005 to December 2012. The seasonal variations in air pollutants were also examined. Additionally, a regression analysis between the daily mass concentration of air pollutants and metrological parameters has been carried out. The correlation coefficients between climatic factors and air pollutants were found to be positive with the exception of the correlations between wind direction and SO2 and visibility and NO2. Additionally, the time series of AOD and ASMF, two MODIS-derived daily and monthly mean columnar aerosol parameters, are examined over Delhi, Hisar, and Shimla from 2005 to 2012. The maximum and minimum AOD values for Delhi, Hisar, and Shimla, respectively, are 2.3 and 0.08, 3.5 and 0.09, and 2.6 and 0.06. However, at all three locations, ASMF fluctuated between 0 and 1. The highest values of AOD were observed in the months of June and August, with a pattern of increasing values from January to June and a pattern of decreasing values from August to December. While an increasing pattern was seen during the post-monsoon and winter months, ASMF was found to diminish from February up to April or May. A back-trajectory analysis of the air mass is used to examine the effects of the observed increased air pollution from the IGP over the Himalayan city of Shimla. The trajectories (23%) passing over the IGB in a southeasterly direction were seen to have an impact on Shimla.
Keywords: Air quality, anthropogenic, aerosol optical depth, aerosol small mode fraction, Himalaya, IGP.
1 Introduction
By altering the solar spectrum and reducing the amount of solar radiation that reaches the earth’s surface, atmospheric air pollutants—primarily aerosol have a direct impact on the global climate system. They also have an indirect impact by affecting cloud microphysics and, consequently, the hydrological cycle (Ramanathan et al., 2001). The heating of the lower and mid-troposphere, solar dimming, sea-land temperature gradients, cloud microphysics, monsoon circulation, and rainfall distribution are all potential climate impacts of aerosols over the area (Lau et al., 2006; Gautam et al., 2010). Numerous processes and events that occur in the Indo-Gangetic Basin and other locations determine the mass concentration of aerosols across the Indian subcontinent, particularly over the Indo-Gangetic Basin (which includes the operating sites of Delhi, Hisar, and Shimla). The mechanisms are too complicated to comprehend. Large-scale burning of agricultural (rice) crop residue occurs in the Indian Great Bay Region (IGB) every year during the post-monsoon season, primarily in the northwest Indian states of Punjab, Haryana, and western Uttar Pradesh (Sarkar et al., 2013). From the burning sites, the pollutants travel approximately 1000 kilometres downwind, encompassing the whole IGB from west to east. The Arabian Sea and central south India can occasionally be impacted as well, depending on the wind direction and speed (Badarinath et al., 2009a and 2009b). In addition to natural sources, industrial processes and the increased use of fossil fuels and other anthropogenic sources resulted in the production of enormous volumes of air pollutants (Guttikunda et al., 2003; Rengarajan et al., 2007; Srivastava et al., 2012). Understanding the various causes of environmental pollution and their implications is crucial because IGB is one of the most polluted regions due to the presence of several urban megacities and numerous industrial sites. For this reason, we have selected three working sites for this study. To comprehend the differences in air quality between plain and mountainous locations, consider the metropolitan megacity of Delhi, the plain location of Hisar, and the hilly site of Shimla.
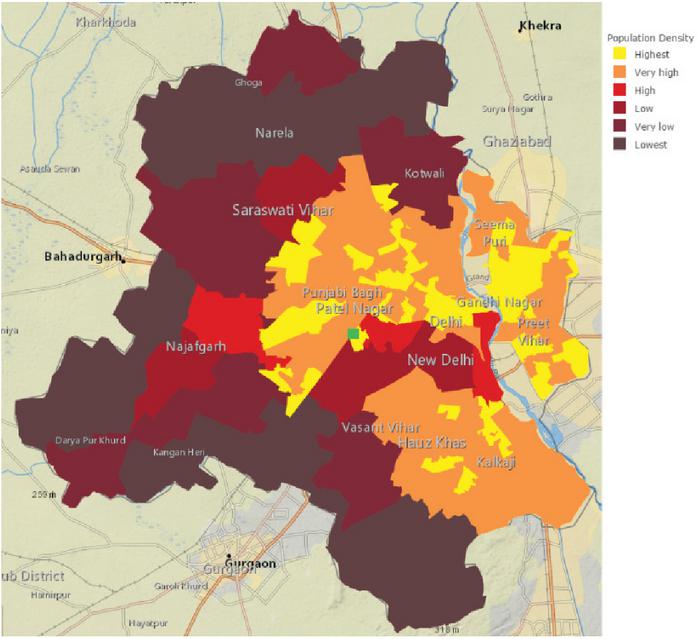
Figure 1 New Delhi region showing the location of the measurement site, Mayapuri (filled green square) and population density (filled colors).
(Source: www.arcgis.com (https://www.arcgis.com/home/webmap/viewer.html,webmap=9ba9043482e84b608659de3e1f7fc9ab)).
2 Site Description and Meteorological Condition
Figures 1 and 2 display maps of locations such as Delhi, Hisar, and Shimla. At a height of roughly 218 meters above mean sea level, Delhi is located between latitudes 28°21’17" and 28°53’ and longitudes 76°20’37" and 77°20’37". It is roughly 160 kilometres south of the southern Himalayas. Shimla is located in the southwest Himalayan hills at 31.61°N 77.10°E. It is 2,206 meters above mean sea level on average and stretches along a ridge with seven spurs. In Shimla, the weather is generally mild in the summer and chilly in the winter. Hisar experiences extremely hot summers and comparatively cool winters due to its continental climate. Summer time maximum daytime temperatures range from 40 to 46 °C. It fluctuates between 1.5°C and 4°C in the winter. In May 1944, the highest recorded temperature was 48.3°C, while in January 1929, the lowest recorded temperature was 3.9°C. A large portion of Delhi’s overall pollution is caused by vehicles (Gurjar et al., 2004).
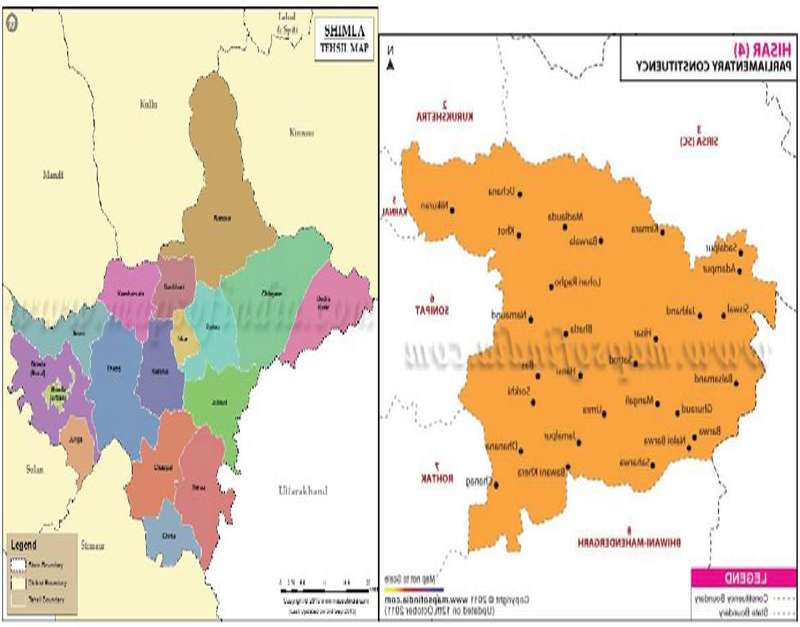
Figure 2 Data collection sites of (a) Shimla regionand (b) Hisar region.
3 Instrumentations and Data Analysis
In order to ascertain the influence of meteorological characteristics on the ambient air of these stations during the study period, we have created a correlation between a number of weather parameters and the mass concentration of air contaminants. The India Meteorological Department in New Delhi also provided three stations—Delhi, Hisar, and Shimla—with concurrent meteorological data, including wind direction, wind speed, temperature, humidity, and visibility. For eight years, from 2005 to 2012, the CPCB measured a variety of air quality data, including respirable suspended particulate matter (RSPM), suspended particulate matter (SPM), sulphur dioxide (SO2), and nitrogen dioxide (NO2) in the ambient air in an industrial area, Mayapuri, West Delhi, residential area, near bus stand, Shimla, and residential area, Guru Jambheshwar University, Hisar. A comparison has also been made between the current level of air pollutants and the National Ambient Air Quality Standards (NAAQS) recommended by the CPCB in India (CPCB, 2003). For the duration of the investigation, the CPCB (http://www.cpcb.nic.in) collected and tracked the daily mass concentration of different air pollutants. The gravimetric approach was used to record RSPM (also known as PM10) data. SPM, or particulate matter with a diameter of less than 100 µm, has also been gathered. Because of its enormous quantity, it has a relatively limited lifetime in the atmosphere. The modified Jacob and Hochheiser method is used to measure the mass concentration of NO2, while the modified West and Gaeke method and UV-Fluorescence method are used to determine the mass concentration of SO2. A spatial resolution of 1o × 1o was used to derive the columnar aerosol optical depth using the Level-3 MODIS (Moderate Resolution Imaging Spectro-radiometer) gridded atmosphere monthly global product "MOD08_M3" (http://daac.gsfc.nasa.gov/MODIS/TERRA/atmosphere/MOD08\_M3.html). From MODIS, we also gathered the aerosol small mode fraction (ASMF). Here, Terra and Aqua are averaged to provide AOD and ASMF. Terra and aqua were averaged throughout the day to estimate the daily averaged AOD and ASMF. All of the daily mean spectral AOD and ASMF readings were grouped into calendar months and averaged to determine the corresponding monthly mean spectral AOD and ASMF.
4 Results and Discussion
4.1 Study of Surface Meteorological Parameters
4.1.1 Monthly mean variability of surface meteorological parameters
Figure 3(a–d) displays the monthly mean variability of surface meteorological parameters over Delhi, Hisar, and Shimla between 2005 and 2012. Delhi experiences an increase in temperature from January until the middle of the year, followed by a decline until December. Both Shimla and Hisar show a similar pattern, albeit Shimla’s value is low. There are significant variations in Delhi’s visibility throughout the year. While Shimla’s visibility value is nearly consistent from January to December, Hisar’s pattern is similar to Delhi’s, albeit with a lower value. For every site, the pattern of wind speed and temperature is extremely similar. But starting in November, its value rises once more. From January to December, the wind direction in Delhi and Hisar diminishes, but Shimla finds it quite upsetting.

Figure 3 Monthly mean mass variability of Temperature, Visibility, Wind speed, and Wind Direction along with their standard deviation (std.) in Delhi, Hisar, and Shimla from 2006 to 2012.
4.1.2 Inter-seasonal variability of surface meteorological parameters
Figure 3(a–d) displays the seasonal mean variability of surface meteorological parameters over Delhi, Hisar, and Shimla between 2005 and 2012. In all seasons, the temperature in Delhi and Hisar is roughly the same. Compared to Delhi and Hisar, Shimla experiences the lowest temperatures throughout the year. Compared to Delhi, Hisar has better visibility throughout the year. In comparison to Hisar, Delhi experiences comparatively strong wind speeds throughout the year. At Delhi and Hisar, the wind was seen to be almost coming from the same directions seasonally.
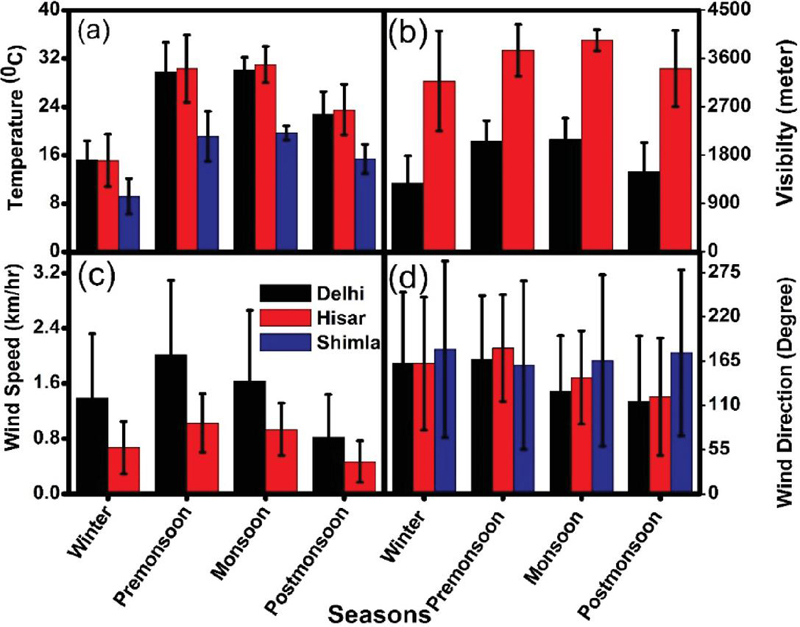
Figure 4 (a–d) Seasonal mean mass variability of Temperature, Visibility, Wind speed, and Wind Direction along with their standard deviation (std.) in Delhi, Hisar, and Shimla from 2006 to 2012.
4.1.3 Annual variability of surface meteorological parameters
Figure 4(a–d) displays the yearly mean variability of surface meteorological parameters over Delhi, Hisar, and Shimla over the course of the study. Throughout the study period, Delhi’s temperature, visibility, and wind direction are all lower than those of Hisar. Throughout the whole study period, Delhi’s wind speed is higher than Hisar’s. During the research time, Hisar’s temperature, visibility, and wind direction are higher than Shimla’s. In the case of Shimla, a downward trend in temperature is noted between 2010 and 2012. Every year, Shimla’s visibility is essentially constant.
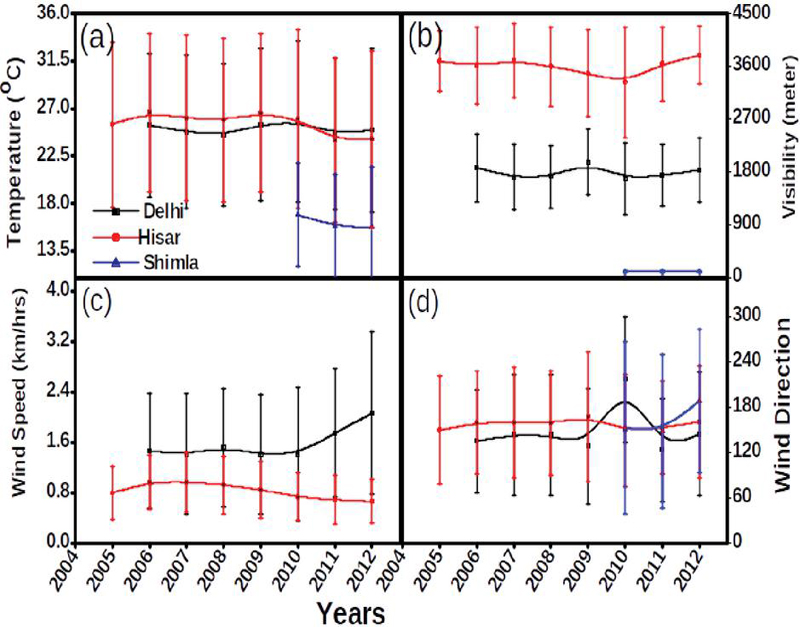
Figure 5 (a–d) Yearly mean mass variability of temperature, Visibility, Wind speed, and Wind Direction along with their standard deviation (std.) in Delhi, Hisar, and Shimla from 2006 to 2012.
4.2 Study of Aerosol in Delhi, Hisar, and Shimla
4.2.1 Monthly mean variability of air pollutants
Figure 5(a–d) displays the monthly mean variability in the mass concentration of observed air pollutants in Delhi, Shimla, and Hisar throughout the period of 2005 to 2012. The monthly mean NO2 variability across Delhi, Shimla, and Hisar during the study period is displayed in Figure 5(a). According to the report, Delhi’s NO2 levels showed a modest decline from January to June and a sharp rise from September to December every year. Throughout the entire period, there are two elevated NO2 peaks: one in the winter and one in the post-monsoon. Their co-emitting sources with varying emission strengths are suggested by the results. However, during the study period, NO2 for Shimla and Hisar exhibits a similar consistent character (with the exception of Hisar in 2005). The monthly mean variability in SO2 over Delhi, Shimla, and Hisar during the study period is displayed in Figure 5(b). According to this data, Delhi’s SO2 fell from January to May, rose from September to October, and then fell once more until December throughout the study period. However, during the study period, SO2 in Shimla and Hisar exhibits a similar consistent character (with the exception of 2005 in Hisar). Nonetheless, a minimum SO2 value was recorded in Delhi from May to September during the summer and monsoon seasons. The monthly mean RSPM variability across Delhi, Shimla, and Hisar over the 2005–2012 research period is displayed in Figure 5(c). An abrupt rise in RSPM.
However, a relatively lower value was observed during the monsoon period, which could be due to the washout process for rain activities during the period. But RSPM in Shimla and Hisar show similar constant nature in the study period. Figure 5(d) shows the monthly mean variability of SPM over Delhi, Shimla, and Hisra in the study period. In the figure, similar nature in its variability can be seen as observed for RSPM.
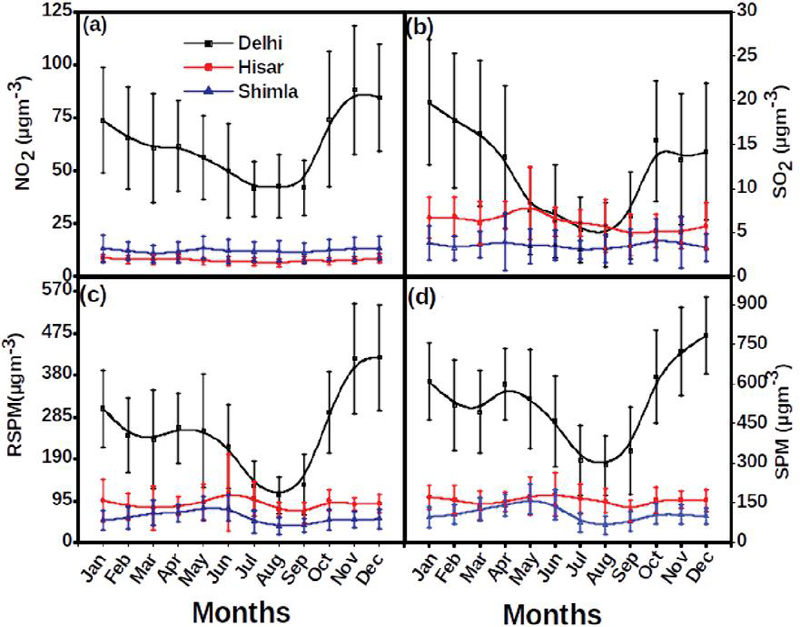
Figure 6 (a–d) Monthly mean mass variability of Air pollutants for Delhi, Hisar, and Shimla from 2005 to 2012.
4.2.2 Intra-seasonal variability of air pollutants
During the study period, Figure 6(a–d) illustrates the intra-seasonal variability of air pollutants over the industrial region of Mayapuri, West Delhi, over a residential area of Guru Jambheshwar University, Hisar, and over a residential area near the bus terminal, Shimla. In every season, Hisar and Shimla exhibit the highest concentrations of all Delhi species, including NO2, SO2, RSPM, and SPM. This could be because of steady meteorological conditions and increased emission sources. In every season, Hisar exhibits higher concentrations of species like SO2, RSPM, and SPM than Shimla, whereas Shimla has higher concentrations of NO2. For all stations, the winter and post-monsoon seasons show the highest mass concentrations of all air pollutants, while the monsoon and pre-monsoon seasons show the lowest mass concentrations of all air pollutants. This is primarily because of washout processes brought on by increased rain activity (Tiwari et al., 2012). Due to the large mass concentration of air pollutants, it is seen that the primary factors influencing the dispersion, transit, and accumulation of air pollutants are meteorological factors including temperature, visibility, and wind speed.
Because Delhi’s wintertime atmosphere is marked by extremely low relative humidity and very little solar heating of the land, along with extremely low ventilation coefficients, there is generally less dispersion of aerosols, which results in an increase in the concentrations of fine mode particles. We see a higher exposure risk as a result of this process when air pollutants are trapped in the lower atmosphere. Under such circumstances, there is a greater chance of secondary aerosol generation (Lihavainen et al., 2010). The long-range movement of tiny particles during the post-monsoon is essential (Tiwari et al., 2012, Lihavainen et al., 2010). Crop harvest and agricultural land clearing from post-monsoon biomass burning are frequent occurrences in the study region’s predominantly agricultural surroundings. Significant smog development and an increase in PM and ozone levels will result from the burning smoke that reaches Delhi (NASA, 2008).
Algorithm 1 (a–d) Inter-Seasonal mean mass variability of air pollutants for Delhi, Hisar, and Shimla from 2005 to 2012.
In the current research, the higher concentrations of PM2.5 (69 gm-3) as compared to NAAQS, which varied from 44 to 147 gm-3 at Patiala are reported by Awasthi et al. (2010). This high value of PM2.5 is located northwest of Delhi near the foothills of the Himalayas. They are observed that due to the burning of crop residue, the concentration of fine particulate matter was increased substantially (78%) during post-monsoon (October to November) and their maximum value was observed from 100 to 147 gm−3 in 2009. Badarinath et al. (2009) also reported the same high concentrations during exhaustive burning of rice crop residue in the IGP region from October to November. Hence, the larger influence on certain anthropogenic activities related to agriculture during the winter season (Tiwari et al., 2012) was only due to the high concentration of aerosols.
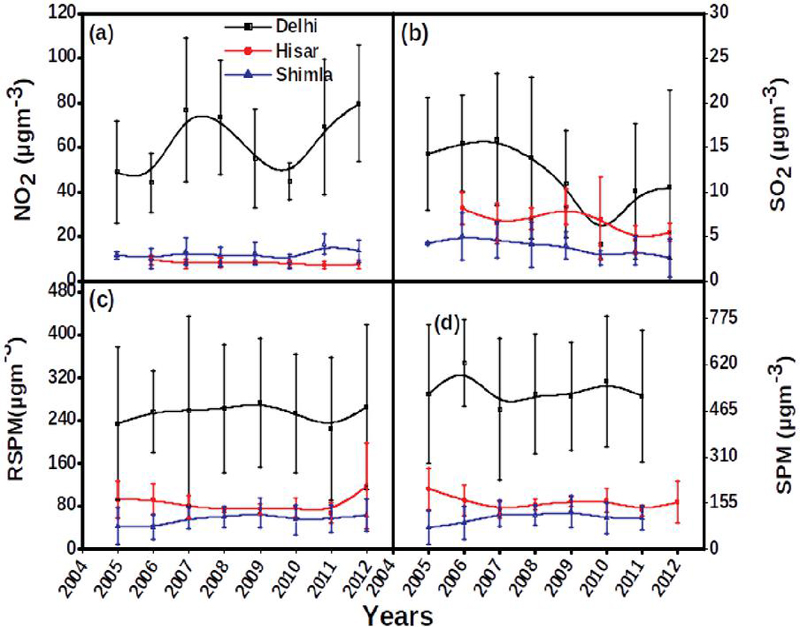
Figure 7 (a–d) Yearly mean mass variability of Air pollutants for Delhi, Hisar, and Shimla from 2005 to 2012.
4.2.3 Inter-annual variability of air pollutants
Figure 7(a–d) displays the inter-annual variation in the mass concentration of air pollutants over Delhi, Shimla, and Hisar between 2005 and 2012. The annual mean variability of NO2 over Delhi, Shimla, and Hisar during the research period is displayed in Figure 7(a). According to the statistic, Delhi’s NO2 rose between 2006 and 2007, then fell between 2007 and 2010, before rising once more between 2010 and 2012. Shimla and Hisar’s NO2 showed a similar pattern between 2005 and 2010. However, Shimla’s NO2 levels rose between 2010 and 2011.
Figure 7(b) shows the yearly mean variability of SO2 over Delhi, Shimla, and Hisar during the study period. In the figure, SO2 in Delhi decreased from 2006 to 2009, increase up to 2010 and again decrease in 2011 and 2012. SO2 in Hisar increased from 2007 to 2009 and increase from 2009 to 2011. SO2 in 2006 and 2012 shows opposite behaviors for Shimla and Hisar.SO2 in Shimla shows an almost constant nature from 2006 to 2012. Figure 7(c) shows the yearly mean variability of RSPM over Delhi, Shimla, and Hisar during the study period. In the figure, RSPM in Delhi increased from 2005 to 2009, decrease from 2009 to 2011, and again increase in 2012. From 2005 to 2008, RSPM exhibits the opposite pattern, and from 2008 to 2011, it exhibits a similar pattern. The annual mean variability of SPM across Delhi, Shimla, and Hisar during the research period is displayed in Figure 7(d). According to the data, Delhi’s SPM rose between 2005 and 2006, fell between 2006 and 2007, and then rose once more between 2007 and 2010. For Shimla and Hisar, SPM displays the opposite pattern from 2005 to 2007 and a similar pattern from 2007 to 2011.
4.2.4 Effect of meteorology on the distribution of air pollutants
Correlation analyses between the recorded surface meteorological parameters and each species of air pollutant were conducted in order to comprehend the impact of these parameters on the distribution of different air pollutants over these three stations during the study period. With the exception of SPM, which, as Table 1 illustrates, has a positive association with wind speed, all of Delhi’s air pollutants exhibit a substantial negative correlation with each species of surface meteorological data.
Table 1 Inter-annual correlation coefficient between air pollutants like NO2, SO2, RSPM, and SPM and meteorological parameter (Wind speed: WS, Wind Direction: WD, Temperature: Temp, and visibility: VS.) in Delhi, Hisar, and Shimla for the study period 2006 to 2012 for Delhi, 2005 to 2012 for Hisar and 2010 to 2012 for Shimla
| Station | Parameters | Wind Direction | Temperature | Visibility | Wind Speed |
| NO2 | -0.34 | -0.43 | -0.4 | -0.33 | |
| Delhi | SO2 | -0.07 | -0.45 | -0.19 | -0.002 |
| RSPM | -0.27 | -0.4 | -0.48 | -0.9 | |
| SPM | -0.26 | -0.29 | -0.36 | 0.07 | |
| Hisar | NO2 | 0.08 | -0.15 | -0.05 | 0.25 |
| SO2 | 0.05 | -0.19 | -0.19 | -0.02 | |
| RSPM | 0.07 | 0.07 | -0.06 | 0.05 | |
| SPM | 0.08 | 0.1 | -0.13 | 0.09 | |
| Shimla | NO2 | 0.09 | 0.02 | -0.003 | |
| SO2 | -0.06 | -0.03 | 0.07 | ||
| RSPM | 0.1 | -0.18 | 0.132 | ||
| SPM | 0.07 | 0.14 | 0.33 |
One of the most important meteorological factors that affects how air pollution spread throughout the atmosphere is wind speed. With the exception of SO2, which is proven to be unaffected by wind speed, high wind speeds can carry air pollutants from one location to another. The reduced bulk concentrations of SO2 during the research period may be the cause of this. Table 1 displays the regression analysis for Delhi between the daily mass concentration of air pollutants and meteorological factors like temperature, visibility, wind direction, and speed. While RSPM and SPM have a weak correlation with wind speed, temperature, and visibility, NO2 and SO2 have a very strong correlation with these variables. Temperature and NO2 and SO2 showed extremely strong significant correlations (0.43 and 0.45), but wind direction and SO2 showed very poor correlations (0.07). There is a modest association (0.002) between SO2 and wind speed, but a strong correlation (0.48) between visibility and RSPM. With the exception of wind speed and SPM, which are inversely proportional to one another—that is, if the mass concentration of aerosols rises, the meteorological parameter falls—a negative correlation coefficient between meteorological parameters and aerosols is seen throughout the whole study. According to Table 1, every air pollutant for Hisar exhibits a substantial positive association with wind direction and speed, with the exception of SO2, which exhibits a negative correlation with both temperature and wind speed.
All the air pollutants for Hisar show a significant negative correlation with visibility. Regression Analysis between the Daily mass concentration of air pollutants and metrological parameters such as wind speed, wind direction, temperature, and visibility was shown in Table 1. NO2 and SO2 are well corroborated with wind speed and visibility, but RSPM and SPM are hardly corroborated with wind speed and visibility. Moreover, it is seen that the concentration of NO2 increases effectively with increasing the wind direction and the concentration of RSPM and SPM increases effectively with increasing the wind direction. A significant positive correlation (0.25) was observed between wind speed and NO2 and a weak negative correlation (0.05) was observed between NO2 and visibility. Visibility is significantly correlated negatively with all Hisar air contaminants. Table 1 displayed the results of a regression analysis between the daily mass concentration of air contaminants and meteorological factors such temperature, visibility, wind direction, and speed. While RSPM and SPM are barely correlated with wind speed and visibility, NO2 and SO2 are substantially correlated with these variables. Furthermore, it is shown that rising wind direction successfully raises NO2 concentrations, whereas rising wind direction also effectively raises RSPM and SPM concentrations. There was a mild negative association (0.05) between NO2 and visibility and a strong positive correlation (0.25) between wind speed and NO2,association between aerosols and meteorological factors. With the exception of SO2, which exhibits a negative connection with temperature and wind direction, and NO2, which exhibits a negative correlation with visibility, all of the air pollutants for Shimla exhibit a positive correlation with meteorological parameters, as indicated in Table 1 displayed the results of a regression study between the daily mass concentration of air contaminants and meteorological factors as temperature, visibility, and wind direction. Additionally, it was shown that as wind direction increases, the concentration of SO2 pollutants efficiently reduces. Additionally, it was shown that as the wind direction increases, the SPM concentration effectively rises. Additionally, it was shown that as visibility declines, the NO2 content effectively drops. Additionally, it was observed that improved sight effectively raises the concentration of SO2 pollutants. Additionally, it was observed that improved visibility effectively raises the concentration of RSPM contaminants. Additionally, it was observed that as the temperature rose, the NO2 content effectively increased. Also, it was seen that the concentration of RSPM increases effectively with increasing the temperature. Also, it was seen that the concentration of SPM increases effectively with increasing the temperature. A very high significant correlation (0.09) was observed between wind direction and NO2 and a very weak significant correlation (0.003) was observed between NO2 and visibility. A very high significant correlation (0.18) was observed between visibility and SO2 and a very weak significant correlation (0.06) was observed between SO2 and Wind direction. Temperature and RSPM showed a very strong significant association (0.07), while RSPM and wind direction showed a very weak significant correlation (0.10). Visibility and SPM showed a very strong significant association (0.33), while SPM and wind direction showed a very poor significant correlation (0.07). We found that there is both a positive and a negative association between aerosols and meteorological indicators throughout the entire study. The reason for the strongest association is that pollutants’ concentrations effectively fall as wind speed, visibility, and temperature rise, indicating that pollutants are being diluted into the atmosphere. Cheng and Lam (1998) examined the effect of wind on TSP concentrations in Hong Kong in a different study and discovered a same correlation. Additionally, it was discovered that the wind speed was inversely proportional to the PM2.5 concentrations that were tested close to a busy road in Paris (Ruellan and Cachier, 2001).
4.3 Variation of Columnar Aerosol Optical Depth and Aerosol Small Mode Fraction
4.3.1 Monthly, seasonally, and annual variability of aerosol optical depth
The monthly, seasonally and annual variability of AOD from 2005 to 2012 is shown in Figure 7(a–c) for all the stations. The figure shows the time series of monthly mean AOD (at 550 nm) from MODIS over Delhi for the study period from 2005–2012, except for 2006 and 2010, Shimla and Hisar from 2005–2012. Approximately an increasing pattern was observed from January to June and a decreasing pattern was observed from August to December and their maximum values were observed between June-August (Figure 7a). From Figure 7(b) in the case of Delhi, the highest monthly mean AOD was observed during monsoon while the lowest was recorded in the winter season and case of Shimla, the highest mean AOD was observed during monsoon, while the lowest was recorded in the winter season and case of Hisar, the highest mean AOD was observed during monsoon, while the lowest was recorded in the winter season. Hence AOD is highest in case of the winter season for Delhi than Hisar and similar for Hisar than Shimla. A similar pattern is observed for summer, monsoon, and post-monsoon. In all the seasons, AOD is higher for Delhi than Hisar and AOD is higher for Hisar than Shimla. Further,annually the AOD is unchanged from 2005 to 2012 in the case of Shimla. But little change was observed in the case of Delhi and Hisar.
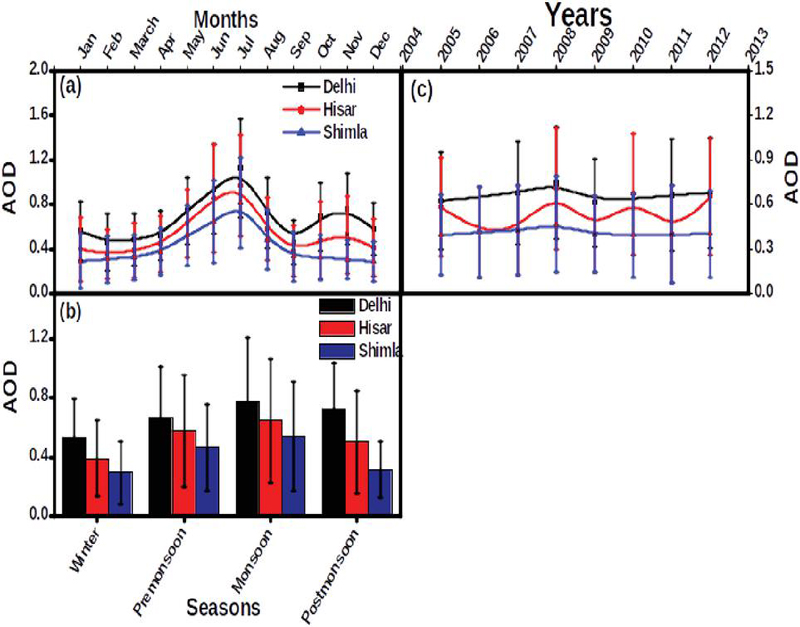
Figure 8 (a–c) Monthly, seasonally and annually variability of Aerosol Optical Depth from 2005 to 2012 for all stations.
As far as AOD is concerned, Sharma et al. (2013) observed the value ranges from as low as 0.08 to as high as 2.77, revealing a mean of 0.82 ± 0.39 in Greater Noida. They further showed that for a few days. the very low AOD values were observed while AODs value on the 818 days (~70%) were ¿0.6, which indicate a severe aerosols-laden atmosphere over Greater Noida, despite the mostly rural environment of the region. Delhi pollution strongly influences the atmospheric aerosols of Greater Noida, Because a similar range of AOD ¿ 0.6 is reported for an urban station like Delhi (Lodhi et al., 2013). The high value of AOD was also observed due to the construction activities with the Dadri power plant over Greater Noida. But the influence of
the local traffic and vehicular emission is much lower than that of another urban Indian environments. Because Kanpur is a highly polluted region in IGP as well as those reported over several Indian cities (Moorthy et al., 2013). The mean AOD is higher than those reported over Kanpur (Singh et al., 2004; Eck et al., 2010; Giles et al., 2011; Kaskaoutis et al., 2012). The results revealed a significant daily, monthly and seasonal variability of the aerosols and Angstrom wavelength exponent, with higher values of AOD during the post-monsoon (0.98 ± 0.5) and winter (0.87 ± 0.34). But the aerosol of different sizes, compositions, and source regions is influenced by a very high turbid environment due to a mean AOD value of 0.82 ± 0.39 (Sharma et al., 2013).
4.3.2 Monthly, seasonally, and annually variability of aerosol small mode fraction
The monthly, seasonally, and annually variability of aerosol small mode fraction (ASMF) from 2005 to 2012 for all three stations are shown in Figure 8(a–c). Figure 8(a) shows the monthly variation of ASMF, in the figure approximately decreasing pattern was observed from January or February up to April or May and an increasing pattern was observed from April or May up to August or September and the approximately decreasing pattern was observed from August or September up to October or November and increasing patter were observed up to December. From Figure 8(b), ASMF is higher for Shimla than Hisar and Delhi and also higher for Delhi than Hisar in post-monsoon and ASMF is higher for Delhi than Hisar and Shimla in case of Pre-monsoon and post-monsoon. ASMF is higher for Hisar than Shimla in pre-monsoon and post-monsoon and ASMF is higher for Shimla than Delhi and Hisar in winter and monsoon. From Figure 8(c), ASMF is found to be continuously increasing from 2005 to 2012 in the case of Shimla. A similar pattern is observed in the case of Delhi and Hisar. The time series of mean monthly AOD over Delhi NCR from MODIS and MISR is observed (Srivastava et al. 2014) along with the upper and lower bounce of error. Both the sensors captured the seasonal cycle of AOD (peak during the May-August and low during February-March) and inter-annual variability in the region as discussed by Lodhi et al. (2013). Based on the ground-based measurement, a large discrepancy is observed in the absolute value. The average daily, as well as the average monthly variation of the AOD at 500 nm, have been reported for the entire period of observation (Soni et al., 2011), during April-May, the AOD values are high and are also associated with very low values due to the abundance of the dust aerosols. In contrast, the high AOD in winter (November-December) is associated with high values, indicating an abundance of fine mode smoke and anthropogenic particles that are dominant during this period due to several open fires for heating and bursting of firecrackers during festival seasons (Attri et al., 2001). The high AOD values in Delhi are attributed to the very high concentration of the local population, mainly contributed by vehicular pollution (~80%) industry (~12%), and domestic use (~8%) in the cities (Singh et al., 2010. According to the economic survey report of Delhi 2007–2008, the vehicular density is more than 10 times the average vehicular density of the country with more than 5.5 million vehicles, which is further increasing at an average annual rate of 8–10%. The high AOD during winter is mainly due to local metrological conditions developed over Delhi when the boundary layer is low and due to relatively low wind speed, the ventilation coefficient is also very low (Bano et al., 2013), resulting in the accumulations of pollutants and aerosols particles.
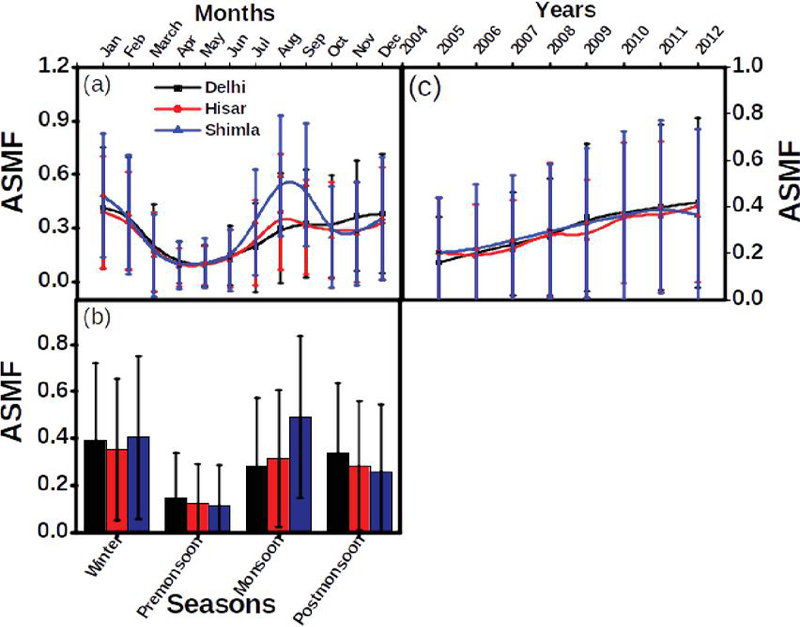
Figure 9 (a–c) Monthly, seasonally, and annually variability of Aerosol small mode fraction from 2005 to 2012 for all stations.
4.4 Air Mass Back-trajectory Cluster Analysis for Source Identifications
Figure 9(a–b) provides insight into the air mass trajectory pathways. In this respect, 7-day forward trajectories were obtained via the HYSPLIT (Hybrid Single-Particle Lagrangian Integrated Trajectory) model (Draxler and Rolph, 2003). The figure depicts that about 41.74%, of air masses, are coming from the North-Northwest region which is shown by the black cluster and 16.06% of air masses are from the west-southwest region of India which is shown by the blue cluster. But in the case of Shimla, 34.95% of air mass is coming from the North-Northwest region which is shown by the black cluster and 4.41% is coming from the west-southwest region which is shown by the blue cluster. Therefore, both Delhi and Shimla are mostly affected by the North-Northwest region of India. Usually, a favorable condition for easterly transport along the IGP (Kaskaoutis et al., 2014) is possible only due to the meteorology field over the Indian subcontinent during the post-monsoon season, while central south India effect by the air mass shifting toward the west-southwest in some case (Badarinath et al., 2009a) and the Arabian Sea (Badarinath et al., 2009b). The analysis shows that the traveling height of the air masses is below 500–800 m in the vast majority of the case whereas the air masses over the IGP can travel above the boundary layer in a few cases, especially during the pre-burning and early burning periods. Smoke-laden air masses originating from Punjab usually can travel at higher altitudes (2–2.5 km) over central India which justifies previous results in which elevated smoke-aerosol layers are observed up to 3km on certain days of October and November (Badarinath et al., 2009a) depending upon the meteorological conditions. The cloud albedo, microphysical properties, and radiative forcing of marine stratocumulus clouds are affected by smoke-laden air masses as earlier observed (Brioude et al., 2009). Whereas the Himalayan-Karakoram-Hindu Kush mountain range is completely affected by the low-level smoke air masses. Simultaneous measurement of mass concentrations of air pollutants like NO2, SO2, RSPM, and SPM for the study period from January 2005 to December 2012 over Delhi, Hisar, and Shimla were investigated along with the impact of surface meteorological parameters on its distributions. A slight decrease was observed from January to June and a sudden increase from September to December in each year for NO2, SO2, RSPM, and, SPM of Delhi. But NO2, SO2, RSPM, and SPM in Shimla and Hisar show similar constant nature in the study period (except 2005 of Hisar).
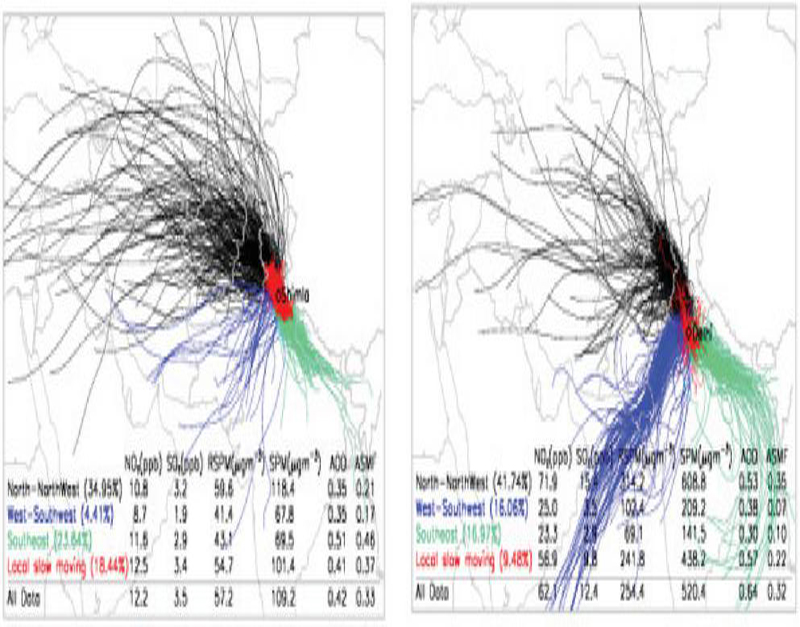
Figure 10 Cluster air mass back-trajectory analysis at (a) Shimla and (b) Delhi during the entire study period and Shimla.
5 Conclusions
From 2005 to 2012, we examined the average variation in mass concentrations of columnar and near-surface aerosols over Delhi, Shimla, and Hisar. For every station, the inter-seasonal variability of air contaminants during the research period was also examined. Compared to Hisar and Shimla, Delhi has the highest concentration of all species, including NO2, SO2, RSPM, and SPM, during all seasons. This could be because different emission sources dominate the station. However, another significant factor contributing to the production of particulate matter during the post-monsoon season is the burning of firecrackers and agricultural biomass during the Deepawali celebration, which takes place primarily between October and November each year. In all seasons, the species such as SO2, RSPM, and SPM are more abundant in Hisar than in Shimla; however, the concentration of NO2 is higher in Shimla than in Hisar. However, for all stations, the winter and post-monsoon seasons had the highest concentrations of all air pollutants, while the monsoon and pre-monsoon seasons had the lowest concentrations, primarily as a result of washing out processes brought on by increased rain activity. The research period’s frequency distribution of mass concentrations of air pollutants above Delhi shows that the city’s environment is more hazardous from a health perspective because of the high loading of NO2, SO2, RSPM, and SPM particles into the atmosphere. This is mostly because of Delhi’s climate and emissions from several man-made sources. In order to comprehend the influence of meteorological characteristics on the aerosol distribution over the station, the link between the particle mass concentration of air pollutants and surface measured meteorological parameters was also examined. Additionally, a regression analysis between climatic data and the daily mass concentration of air contaminants was examined. With the exception of wind speed and SPM, all of the study’s correlation coefficients between the meteorological variables and air pollutants over Delhi were negative. The exception of visibility (NO2, SO2, RSPM, and SPM) and temperature and wind speed (SO2), the correlation coefficients between the meteorological variables and air pollutants above Hisar were found to be positive. With the exception of wind direction with SO2 and visibility with NO2, the correlation coefficients between the meteorological parameter and air pollutants over Shimla were found to be positive. At every location, there was notable variation in the columnar AOD at 550 nm and ASMF on various time scales. The air mass back-trajectory analysis is used to examine the effects of the IGP’s observed increased air pollution on Shimla, a location in the Himalayas. In the North-Northwest parts of India, Delhi and Shimla are the two cities most affected, with about 42% and 35%, respectively. Nevertheless, it has also been discovered that trajectories approaching the IGB from the southeast have an impact on Shimla (~23%).
Acknowledgments
The authors express their gratitude to the India Meteorological Department for supplying surface meteorological data utilised in this work and to the CPCB for providing air quality data. We are also grateful to the NOAA Air Resources Laboratory (ARL) for using http://www.arl.noaa.gov/ready.php to provide the HYSPLIT PC-version model. The usage of MODIS aerosol products is also acknowledged by the authors. The authors would like to thank the Director of IITM, Pune, for his assistance and encouragement.
References
[1] Attri AK, Kumar U and Jain VK (2001) Formation of ozone by fireworks. Nature 411:6841:1015.
[2] Awasthi A, Aggarwal R, Mittal SK, Singh N, Singh K and Gupta PK, (2011) A Study of size and mass distribution of particulate matter due to crop residue burning with seasonal variation in rural area of Punjab, India. J Environ Monit doi10.1039/ C1EM10019J13 (4):1073–1081.
[3] Badarinath KVS, Chand TRK and Prasad VK (2006) Agriculture crop residue burning in the Indo-Gangetic Plains a study using IRS-P6AWiFS Satellite data. Curr Sci 91(8):1085–1089.
[4] Badarinath KVS, Kharol SK, Sharma, AR (2009a) Long-range transport of aerosols from agriculture crop residue burning in Indo-Gangetic Plains e a study using LIDAR, ground measurements and satellite data, J. Atmos. Sol. Terr. Phys. 71- 112–120.
[5] Badarinath, KVS, Kharol S K (2009b), Sharma A.R., Prasad V.K., Analysis of aerosol and carbon monoxide characteristics over Arabian Sea during crop residue burning period in the Indo-Gangetic Plains using multi-satellite remote sensing datasets, J. Atmos. Sol. Terr. Phys. 71- 1267–1276.
[6] Bano T, Singh S, Gupta NC, Soni K, Tanwar RS and Nath S (2011) Variation of Aerosol Black Carbon Concentration and Its Emission Estimates at the Mega City Delhi. Int. J. Remote Sens., in press DOI: 10.1080/01431161.2010.512943.
[7] Barman SC, Singh R, Negi MPS and Bhargava SK (2009) Fine Particles (PM2.5) in ambient air of Lucknow city due to fireworks on Diwali festival. J Environ Biol 30(5):625–632.
[8] Chaloulakou A, Kassomenos P, Spyrellis N, Demokritou P and Koutrakis P (2003) Measurements of PM10 and PM2.5 particle concentrations in Athens Greece. Atmos Environ 37(5):649–660.
[9] Cheng S and Lam SK (1998) Analysis of winds affecting air pollution concentrations in Hong Kong. Atmos Environ 32(14–15):2559–2567 doi: 10.1016/S1352-2310(97)00514-1.
[10] CPCB, Ambient Air Quality Statistics for Indian Metero Cities, CPCB Zonal Office, Bangalore (2003).
[11] Draxler RR, Rolph GD (2003), HYSPLIT (Hybrid Single-Particle Lagrangian Integrated Trajectory) model, NOAA Air Resources Laboratory, Silver, Spring, MD .[Available at http://www.arl.noaa.gov/ready/hysplit4.html.].
[12] Eck TF, Holben BN, Sinyuk A, Pinker R.T, Goloub P, Chen H, Chatenet B, Li Z, Singh RP, Tripathi SN, Reid JS, Giles DM, Dubovik O, Neill NT, Smirnov A, Wang P and Xia X (2010) Climatological Aspects of the Optical Properties of Fine/Coarse Mode Aerosol Mixtures. J Geophys Res 115: D19205.
[13] Gautam R, Hsu NC and Lau KM (2010) Premonsoon aerosol characterization and radiative effects over the Indo-Gangetic Plains: Implications for regional climate warming. J Geophys Res 115: D17208.
[14] Giles DM, Holben BN, Tripathi SN, Eck TF, Newcomb W, Slutsker I, Dickerson R, Thompson A, Mattoo S, Wang S, Singh R, Sinyuk A and Schafer J (2011) Aerosol properties over the Indo-Gangetic Plain: A 1 mesoscale perspective from the TIGERZ experiment. J Geophys Res 116: D18203.
[15] Gurjar BR, Van Aardenne JA, Lelieveld J, Mohan M (2004) Emission Estimates and Trends (1990-2000) for Megacity Delhi and Implications. Atmos Environ 4: 5663–5681 (2004).
[16] Guttikunda SK, Carmichael GR, Calori G, Eck C, Woo JH (2003), The contribution of mega cities to regional sulfur pollution in Asia;Atmos. Environ. 37-11–22.
[17] Kirti Soni, Sachchidanand Singh, Tarannum Bano, Tanwar RS and Shambhu Nath (2011) Wavelength Dependence of the Aerosol Angstrom Exponent and Its Implications Over Delhi, India. Aerosol Science and Technology. American Association for Aerosol Research ISSN: 0278-6826 print / 1521-7388 DOI: 10.1080/02786826.2011.601774.
[18] Kaskaoutis DG, Singh D, Sharma D (2012) Impact of Two Intense Dust Storms on Aerosol Characteristics and Radiative Forcing over Patiala, Northwestern India. Advances in Meteorology Volume 2012, Article ID 956814, 13 pages http://dx.doi.org/10.1155/2012/956814.
[19] Kaskaoutis DG, Kumar S, Sharma D, Singh RP, Kharol SK, Sharma M, Singh AK, Singh S, Singh A, Singh D (2014) Effects of crop residue burning on aerosol properties, plume characteristics and long-range transport over northern India,J. Geophys. Res. 119-5424–5444.
[20] Lau KM, Kim MK and Kim KM (2006) Asian summer monsoon anomalies induced by aerosol direct forcing: The role of the Tibetan Plateau. Clim Dyn 26: 855–864.
[21] Lihavainen H., Kerminen V.M., Remer L.A., Aerosol-cloud Interaction determined by both in situ and satellite data over a northern high-latitude site, Atmos. Chem. Phys.10 (2010) 10987–10995. Check shoud be 2012.
[22] Lihavainen K, Sipil S, Rantanen T, and Sepp ne J (2012) Effects of comprehensive geriatric intervention on physical performance among people aged 75 years and over. DOI: 10.1007/BF03325264. Source: PubMed Aging – Clinical and Experimental Research 24(4):331–8 .
[23] Lodhi NK, Begum SN, Singh S and Kumar K (2013) Aerosol Climatology at Delhi in the Western Indo-Gangetic Plain: Microphysics, Long-Term Trends, and Source Strengths. J Geophys Res 118: 1–15.
[24] Moorthy KK, Suresh Babu S, Manoj MR and Satheesh SK (2013) Buildup of Aerosols over the Indian Region. Geophys. Res. Lett. 40: 1011–1014, doi: 10.1002/grl.50165.
[25] NASA (National Aeronautics and Space Administration) Top Science, Exploration and Discovery Stories of 2008.
[26] Parul Srivastava, Sagnik Dey , Agarwal P and George Basil (2014) Aerosol characteristics over Delhi national capital region: a satellite view. International Journal of Remote Sensing Vol. 35, No. 13, 5036–5052, http://dx.doi.org/10.1080/01431161.2014.934404.
[27] Ramanathan V, Crutzen PJ, Kiehl JT, Rosenfeld D (2001) Aerosols, Climate, and the Hydrological Cycle, Sci. 294 2119–2212.
[28] Rengarajan R., Sarin M.M., Sudheer A.K., Carbonaceous and inorganic species in atmospheric aerosols during wintertime over urban and high-altitude sites in North India,J. Geophys. Res. 112(2007) 1–16.
[29] Ruellan S and Cachier H (2001) Characterization of fresh particulate vehicular exhausts near a Paris high flow road. Atmos Environ 35:453–468.
[30] Sarkar C., Kumar V., Sinha, V. (2013) Massive emissions of carcinogenic benzenoids from paddy residue burning in north India, Curr. Sci. 104 (2013) 1703–1709.
[31] Schwartz JD (2004) The effects of particulate air pollution on daily deaths: a multi-city case crossover analysis. Occupational and Environmental Medicine 61:956 –961.
[32] Singh S, Soni K, Bano T, Tanwar RS, Nath S and Arya BC (2010) Clear-sky direct aerosol radiative forcing variations over Mega-city Delhi. Ann Geophys 28: 1157–1166.
[33] Singh B. P., Srivastava A. K., Tiwari S., Singh S., Singh R.K., Bisht D.S., Lalm D.M., Singh A.K., Mall R.K., Srivastava M.K., Radiative impact of fireworks at a tropical Indian location: A case study, Adv. Met. 2014 (2014) 1–8.
[34] Srivastava AK, Singh S, Tiwari S, Kanawade VP and Bisht DS (2012) Variation between near surface and Columnar aerosol characteristics during the Winter & Summer at Delhi in the Indo Gangetic Basin. J Atmos Solar-Terr Phys 77:57–66.
Biographies

Nand Kishore is a Asistanat Professor in department of physics, Kirori Mal college, University of Delhi. His research work is in Atmosphere Physics from Indian Institude of tropical and Meterology (IITM), Pune with collobration of Gurukul Gangari Viswidayalaya, Haridawar since 2012 and completed Ph.D degree in atmosphere Physics in 2018. He is teaching the basic physics like thermal physics, wave and optics, Quantum Physics, Electronics, Solid state physics etc at graduate level in Kirori Mal college, DU last 14 years. His research work is associated with Aerosol pollutant like No2, So2, RSPM and SPM and metrological parameters like temperature, wind speed, wind direction, Relative humidity etc.

Bipin Singh Koranga is Professor in the Department of Physics, Kirorimal College, University of Delhi. He joined the Theoretical Physics Group at the Indian Institute of Technology Bombay in 2006 and earned his Ph.D. in physics (neutrino masses and mixings) there in 2007. For the past 17 years, he has been instructing graduate-level students in foundational physics and mathematical physics courses. The genesis of the cosmos, physics beyond the standard model, theoretical nuclear physics, quantum mechanical neutrino oscillation, and a few astrological issues are among his areas of interest. He has more than 60 scientific publications to his credit in different international journals. His current areas of focus in study are linked phenomenology and neutrino mass theories.

Atul Kumar Srivastava is presently working as Scientist_E in Indian Institude of Tropical Meterology (IITM), New Delhi. He has completed B.Sc From Puranchal University. In 1998 in Mathematics and Physics. He has completed M.Sc From Banaras Hindu University. In 2001 in Geophysics (Meteorology). He has completed Ph.D From Pune University. In 2008 in Atmospheric Physics. His research work is associated with Aerosol pollutant like No2, So2, RSPM and SPM and metrological parameters like temperature, wind speed, wind direction, Relative humidity etc.
Journal of Graphic Era University, Vol. 13_1, 49–74.
doi: 10.13052/jgeu0975-1416.1313
© 2025 River Publishers