CDH2-microRNA Axis Provides Insights into Sustained Breast Cancer Dormancy in the Bone Marrow Niche
Garima Sinha1, 2, Peter Conaty1, 2, Shyam A. Patel3, Ghassan Yehia4, Sai Vemula1, 2 and Pranela Rameshwar1,*
1Rutgers New Jersey Medical School, Newark, NJ, USA
2Rutgers School of Graduate Studies at New Jersey Medical School, USA
3UMass Chan Medical School, UMass Memorial Medical Center, Worcester, MA 01655, USA
4Genome Editing Shared Resource, Office of Research and Economic Development, Rutgers University, New Brunswick, NJ, USA
E-mail:
*Corresponding Author
Received 18 April 2023; Accepted 21 July 2023; Publication 03 February 2024
Despite long-term remission of breast cancer (BC), cancer resurgence remains a clinical issue. This issue is mostly due to BC cells (BCCs) being able to survive in dormancy for decades. This is particularly relevant to the bone marrow (BM) where the dormant BCCs survive as cancer stem cells (CSCs). The BM niche maintains BCCs in dormancy, and also mediates dedifferentiation of BCCs to CSCs. Since dormancy can occur at any time during the disease, including decades before clinical diagnosis, it is important to understand how these cells survive to allow for the development of safe treatments. Dormant BCCs establish gap junctional intercellular communication (GJIC) with BM niche such as fibroblasts and mesenchymal stem cells (MSCs). GJIC requires connexin 43 (Cx43) but cannot be a safe target since this connexin is also important for hematopoietic function. This study focused on N-cadherin (CDH2) because it facilitates Cx43-mediated GJIC between BCCs and BM niche cells. We found Cx43 and CDH2 mutually regulated their gene expression. Cloning of the 5 regulatory regions of CDH2 unraveled DNA sequences as possible elements of repressor and activator transcription. We identified potential transcription factors (TFs) that could regulate CDH2 and showed how miRNAs that could cross GJIC might be responsible for regulating the TFs. The axis developed by CDH2 and miRNAs provide insights into how CDH2 is maintained at low level to sustain BC dormancy. The findings, together with previous findings, provide avenues for therapeutic intervention to safely reverse and target dormant BCCs in the BM niche.
Keywords: N-cadherin, breast cancer, cancer stem cell, dormancy, bone marrow.
Breast Cancer (BC) continues to be a clinical issue with predicted increase in incidence within the United States [1]. BC cells (BCCs) have preference for the bone marrow (BM), which leads to poor prognosis [2]. In BM, the BCCs can survive in cellular quiescence for decades, which is referred as long-term dormancy [3–5]. Dormancy could occur by cell autonomous mechanism, and by crosstalk with cells of the BM microenvironment [6, 7]. Dormant BCCs mostly reside within the stromal compartment close to the endosteum, which consists of fibroblasts, macrophages, adipocytes, endothelial cells and mesenchymal stem cells (MSCs) [8, 9]. Dormant BCCs have been identified as cancer stem cells (CSCs), which is in line with these cells eliciting tertiary metastasis during cancer relapse [8–17].
In BM, the process leading to dormancy begins once the BCCs enter the marrow cavity. A major BM niche cell that facilitates this early are the MSCs, which are located at the interface between the marrow and periphery [18]. These MSCs can initiate dedifferentiation of the incoming BCCs towards CSCs, and also offer immune protection of the BCCs through increased immune suppressor regulatory T-cells [3, 19]. Once the BCCs reach the endosteal region, they can form gap junctional intercellular communication (GJIC) with BM stromal cells, allowing for the exchange of small molecules such as microRNA (miRNA) [4, 10, 20].
Connexin 43 (Cx43) has been reported as the preferred connexon in GJIC between BM niche cells and CSCs [21]. However, Cx43 is an unlikely therapeutic target due to its role in hematopoiesis as well as functions in other organs [22, 23]. A major issue when developing treatments for dormant BCCs is the similarity between CSCs/dormant BCCs and endogenous stem cells. This is particularly important when targeting CSCs in the BM, which is the home of hematopoietic stem cells (HSCs) [24, 25]. Hence, targeting dormant BCCs in the BM compartment can result in untoward effects on the HSCs. Thus, it is critical to understand BCC survival within the BM niche for effective and safe treatments.
Intracellular interaction between Cx43 and Neuronal-cadherin (N-cadherin)/CDH2 (CD325) is required for GJIC, including communication between BM stroma and CSCs [7]. CDH2 has also been reported to prevent cell differentiation, which is consistent with CSCs losing multipotency when CDH2 was knockdown [7, 22, 26, 27]. Thus, it is crucial to understand the mechanism other than Cx43 that facilitated GJIC between CSCs and BM niche cells.
CDH2 is a 130 kDa protein that belongs to the classical family (class 1) of adhesion molecule [28]. CDH2 is composed of five ectodomains in which EC1-EC5, comprises the transmembrane region, and a cytoplasmic domain of two subunits juxtamembrane and C-terminal [28]. The EC1 domain is compose of the amino terminal of the protein [28]. In the endoplasmic reticulum, CDH2 anchors to the catenin family in a sequential manner [29]. The first catenin to bind CDH2 juxtamembrane is p120, which gets phosphorylated, leading to -catenin binding, followed by -catenin [29]. The CDH2-catenin complex binds to the actin filament, which facilitates migration to the cell membrane [29, 30].
CDH2 is increased when mammary epithelial cells undergo epithelial-mesenchymal transition (EMT) [30]. CDH2 induces cell migration by regulating integrin-dependent polarization of the Rho-GTPase family of proteins, known to co-ordinate cytoskeletal structure to induce cell migration [31]. However, decreased CDH2 can lead to disassociation of GJIC, CSC differentiation, chemosensitivity and increased migration, indicating a complex role of CDH2 during various developmental phases of BC [7].
CDH2 as a potential drug target is supported by reduced BCC growth with pharmaceutical targeting of -secretase and chemotherapy [7]. Since -secretase is important for CDH2 activity, these findings support CDH2 and/or its associated pathway as potential therapeutic targets. It is important to prevent GJIC since this can occur during all phases of the disease [19]. Thus, an understanding of how CDH2 is regulated could provide information to prevent and reverse dormancy. To this end, this study cloned the highly rich GC region of the 5 regulatory region of CDH2 and identified potential activator and suppressor sites. We further showed how signaling by CXCL12 and TGF-1, associated with BC dormancy could be regulated by exchange of miRNAs through GJIC. The implications for these findings are discussed.
Tissue culture media (MEM, RPMI 1640 and DMEM with high glucose), Penicillin-Streptomycin, L-glutamine, hydrocortisone, fetal calf sera (FCS), protease inhibitor were purchased from Millipore-Sigma (St Louis, MO); PE mouse anti-human CDH2 from BD Bioscience (San Jose, CA); Rabbit Polyclonal Anti-Human CDH2 from Abcam (Waltham, MA); rabbit Anti-human Cx43 from Cell Signaling (Danvers, MA), TGF-1 and CXCL12 were purchased from R&D Systems (Minneapolis, MN).
The use of human BM aspirates from healthy donors (18–35 yrs.) was approved by Rutgers Institutional Review Board, NJ. Each donor signed the informed consent.
CCL64, MDA-MB-231 and T47D were purchased from American Type Culture Collection (ATCC, Manassas, VA) and cultured as per their instruction. MDA-MB-231 with stable transfection of pOct4a-GFP was previously described (10). The pOct4a-GFP cells with stable knockdown for CDH2 and Cx43 were previously described [7]. Briefly, the pOct4a-GFP cells were transfected with pRFP-C-RS-Scramble, -CDH2 and -Cx43 shRNA. The stable transfectants were selected with puromycin. The media also contained G418 to ensure stability of pOct4a-GFP. The surviving colonies of cells were verified for CDH2 or Cx43 knockdown, referred as M-Oct4-GFP/scramble-RFP,M-Oct4-GFP/CDH2-shRNA-RFP and M-Oct4 GFP/Cx43-shRNA-RFP. The CSCs using these knockdown cells were isolated by gating the live cells within M-Oct4-GFP/scramble-RFP, M-Oct4-GFP/CDH2-shRNA-RFP, or M-Oct4-GFP/Cx43-shRNA-RFP.
CSCs were sorted by flow cytometry, as described [10]. Briefly, BCCs, stably transfected with pEGFP1-Oct3/4 were sorted, based on relative GFP expression using the FACSDiva (BD Biosciences, San Jose, CA). The top 5% GFP (Oct4) cells represented CSCs [10]. Further sorting for the subsets were used based on the fluorescence tagged shRNA or scrambled vector. The following cells were sorted based on the aforementioned gating scheme: GFP/RFP: MDA-MB-231 Oct4 GFP/scramble RFP, MDA-MB-231 Oct4 GFP/CDH2 shRNA RFP and MDA-MB-231 Oct4 GFP/Cx43 shRNA RFP cells were sorted on the FACSDiva to select GFP/RFP cells.
Adherent BCCs were stimulated with various concentrations of TGF-1 or CXCL12. The cells were used to isolate total RNA for real time PCR or whole cell extracts for western blots.
Stroma cells were cultured from BM aspirates, as described [32, 33]. The aspirate was diluted in -MEM containing 12.5% FCS, 12.5% horse serum, 10mol/L hydrocortisone, 10mol/L -mercaptoethanol and 1.6 mmol/L glutamine and then added to T25 tissue culture flasks. After 3 days, red blood cells and granulocytes were removed by Ficoll-Hypaque density gradient centrifugation. The mononuclear fraction was replaced in the flasks. At weekly intervals, 50% of media were replaced until confluence. At confluence, the non-adherent cells were removed, and the adherent layer washed with sterile tissue culture grade PBS twice. Macrophages were eliminated with trypsin and the detached cells were transferred to a new flask containing -MEM with 20% FCS. After two passages the cells were purified for fibroblasts, which were used in reporter gene studies.
pGL3 basic and pGL3 control were purchased from Promega (Madison, WI); pCR 2.1 from ThermoFisher; pBACGK1.1, Clone CH17, from C.H.OR.I., Richmond, CA. Human CDH2 and Cx43 siRNA, and Risc free (control) were purchased from Dharmacon (Lafayette, CO); human shRNA pRFP-C-RS with scramble sequence, CDH2 shRNA or Cx43 shRNA from Origene Technologies (Rockville, MD) [7].
Table 1 Primer set for specific CDH2 regulatory regions
| Primer | Sequence (5-3) – Forward | Sequence (5-3) – Reverse |
| 1638 to 273 | GCAAGCAATAAAGGCAGA | AGAGCGAGCTGATGACAA |
| 1567 to 273 | TCCCAAGTGTTGAAAAGC | AGAGCGAGCTGATGACAA |
| 1461 to 273 | CAAAAACTGCTCCCCATCCC | AGAGCGAGCTGATGACAA |
| 1251 to 273 | TGTTGTTAGGGGTGGTAGGA | AGAGCGAGCTGATGACAA |
| 1035 to 273 | AAGGTGCGAGCTCCAGAG | AGAGCGAGCTGATGACAA |
| 931 to 273 | CGTCCTTAGTTTGCTGTGTC | AGAGCGAGCTGATGACAA |
| 666 to 273 | GCGGGCTGCAGCAAAA | AGAGCGAGCTGATGACAA |
| 191 to 273 | GAAAGAGGAGCCGAGAAGC | AGAGCGAGCTGATGACAA |
The variable fragments of CDH2 5 regulatory region was amplified from bacteriophage DNA containing human CDH2 promoter region – pBACGK1.1 – clone CH17 (C.H.OR.I., Richmond, CA) using primers listed in Table 1. The sequence corresponds to NCBI sequence, upstream of the translational start site (NCBI ID, NC_000018.10). The cloning steps are described in Supplemental Figure 1. The NCBI primer design database was used to design the primer for amplifying the region -highlighted in yellow. Due to the high GC content of the sequence, we amplified the sequence using Advantage GC2 polymerase mix and PCR kit (Takara Bio, Mountainview, CA). The amplified region was separated by electrophoresis on 2% agarose gel. The band corresponding to the predicted size was cut from the agarose for isolation with Gel Extraction and Purification Kit (Qiagen, Germantown, MD). The resulting DNA was ligated into pCR 2.1-TOPO (Thermo Fisher Scientific, Walthan, MA). The insert within pCR 2.1-TOPO was digested using Kpn1 and Xho1 (Thermo Fisher Scientific, Walthan, MA), separated on 2 % agarose gel and then purified with Gel Extraction and Purification Kit (Qiagen). This final insert was subcloned into pGL3 basic vector (Promega, Madison, WI). Random colonies with pGL3-CDH2 were selected for validation of the insert by PCR. The colony with the highest luciferase activity was validated by sequencing at Genewiz (South Plainfield, NJ).
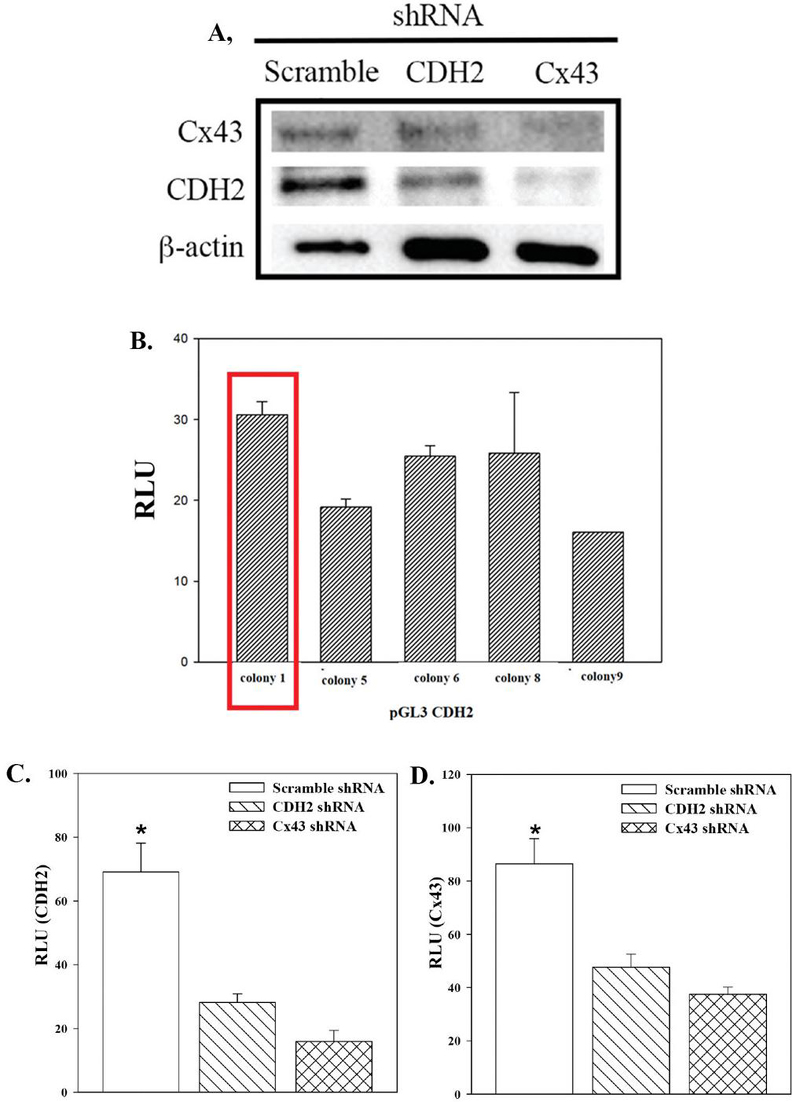
Figure 1 CDH2 and Cx43 cross regulation. A) Western blot for CDH2 and Cx43 with whole cell extracts from CSCs, transfected with scramble shRNA or, knockdown for CDH2 or Cx43. B) BM fibroblasts were co-transfected with pgal and five randomly selected clones of pGL3-CDH2. The reporter gene (luciferase) was normalized with -gal activity and the values presented as mean Relative Luciferase Unit (RLU)SD, n 3. C) and D) MDA-MB-231-Oct4-GFP stably knockdown for CDH2 or Cx43 were used in reporter gene studies for CDH2 (C) or Cx43 (D) activity. The reporter gene (luciferase) was normalized with gal activity and the values presented as mean Relative Luciferase Unit (RLU)SD, n 4. *p0.05.
MDA-MB231 were labeled for membrane CDH2 as described [7]. Briefly, the cells were trypsinized and then washed with 1x PBS. The cells were incubated for 1–2 h for re-expression of membrane proteins in the event that the proteins were degraded with trypsin. After this, the cells were fixed with 3.7% formaldehyde at room temperature for 15 mins. This was followed by incubation with anti-CDH2-PE (1/20 dilution) for 30 mins at room temperature in the dark. The cells were washed with 1X PBS and then immediately analyzed on the FACS Calibur (BD Biosciences).
Real time PCR for CDH2 was performed as described [10]. Briefly, RNA was extracted from samples using TRIzol as per manufacturer’s instruction. The concentration of RNA was quantified using QIAxpert. RNA was converted to cDNA using High-Capacity cDNA Reverse Transcription Kit. Real time PCR was performed using Platinum SYBR Green qPCR SuperMix-UDG Kit and then analyzed on the 7300 Real-Time PCR System (Thermo Fisher Scientific, Foster City, CA) with cDNA as per manufacturer’s instruction. The following primers were used in the PCR mix: CDH2 forward: 5 CAG TGG CCA CCT ACA AAG 3; CDH2 reverse: 5 AAA TGA AAC CGG GCT ATC 3; -actin forward: 5 GCC CTA TAA AAC CCA GCG GC 3; -actin reverse: 5 AGA GGC GTA CAG GGA TAG CA 3; Human GAPDH forward 5 CAG AAG ACT GTG GAT GGC C 3; Human GAPDH reverse 5 CCA CCT TCT TGA TGT CAT C 3.
Whole cell extracts were isolated with a cell lysis buffer (50 mM Tris-HCl (pH 7.4), 100 mM NaCl, 2 mM MgCl, 10% glycerol, and 1% NP-40) as, described [34]. The extracts (15 g) were electrophoresed on 12% SDS-PAGE gel. Proteins were transferred onto polyvinylidene difluoride membranes (Perkin Elmer, Boston, MA). The membranes were incubated overnight at 4C on rocker with anti-Cx43, anti-CDH2, each at 1/1000 dilution in 1% non-fat milk dissolved in 1x PBS tween. Next day, the membranes were washed and then incubated with species specific HRP-tagged IgG at a dilution 1:2000 in 1% milk dissolved in x XPBS tween for 2h. The membranes were developed chemiluminescence using SuperSignal West Femto Maximum Sensitivity Substrate. The band densities were normalized using UN-SCAN-IT densitometry software (Silk Scientific; Orem, UT).
Reporter gene assays were performed as described [35]. M-Oct4 GFP cells with CDH2 or Cx43 knockdown or with scrambled shRNA were transfected with various constructs of the 5 regulatory region of human CDH2 in pGL3-basic. The cells were transfected with Lipofectamine 3000, as per manufacturer’s instruction. The cells were co-transfected with pgal, as described [35]. After 24 h, cell lysates were prepared using 1X Promega lysis buffer. Protein concentration was determined using the Bradford protein assay reagent. Luciferase and -galactosidase levels were quantified using kits from Promega. For calculating relative luminescence unit (RLU), the luciferase values were normalized with -galactosidase.
The miRNA array data were previously reported from our group [4]. This study used the data to establish a link to CDH2 regulation. Briefly, Co-culture of T47D and BM stroma was established as explained in dye transfer assay. After 48 h, the cells were detached with accutase. The cells were then resuspended in 1x PBS with 2% FCS at 10 cells/ml. The cells were then incubated with anti-pan cytokeratin (1:1000) in 4C for 1h. The BCCs was positively selected with Dynabeads M-450 Goat anti-mouse IgG, followed by its detachment using DETACHaBEAD. The positively selected BCCs and negatively selected stromal cells. Total RNA from the selected cells were subjected to ABI Taqman human miRNA arrays (v1.0). The Ct values were normalized to internal control, RNU48, in the ABI array (Ct) for calculating the relative expression (Supplemental Table 1). The relative expression was then compared between the BCCs and Stroma before and after co-culture.
The data were analyzed using ANOVA and student t test p value 0.05 was considered to be significant.
Cx43 mediates transcriptional regulation of CDH2 during neural crest migration [36]. Omics analyses indicated a convergence of genes when Cx43 and CDH2 were knocked down, further supporting a molecular regulation between CDH2 and Cx43 [7]. Since Cx43 and CDH2 are required for Cx43-mediated GJIC [7], we asked if knockdown of Cx43 or CDH2 affected the expression of the other gene. We addressed this question with CSCs from MDA-MB-231 since this subset showed the highest expressions of CDH2 and Cx43 [7, 10]. The CSCs were knockdown for Cx43 or CDH2 or transfected with scramble shRNA. Western blots with whole cell extracts indicated a decrease in CDH2 when Cx43 was knockdown and vice versa (Figure 1A). In order to understand if this dependent regulation is at the transcriptional level, we cloned the 5 regulatory region of CDH2, which is discussed in the next section.
To further understand the regulation of CDH2, we cloned 2000 bp of the 5 regulatory regions of CDH2. Due to the high GC content of the region, we could not achieve reproducible results with gDNA from pooled human samples (Supplemental Figure 1A). We therefore amplified the insert using pBACGK1.1-CDH2 as the template, which contained the CDH2 gene (Supplemental Figure 1). The amplified 2 kb fragment was ligated into the reporter gene vector, pGL3-basic (Supplemental Figure 1). We tested five randomly selected clones for reporter gene activity by transfecting BM fibroblasts and CCL4. Luciferase activity, normalized for -gal, identified the clone with the highest mean RLUSD (Figure 1B, boxed bar). We validated the sequence of clone 1 by DNA sequencing, which was used in subsequent studies, hereafter referred as pGL3-CDH2.
Since the western blot indicated a decrease in Cx43 protein in CDH2 KD BCCs and vice versa (Figure 1A), we tested if this regulation between CDH2 and Cx43 occurred at the level of transcription. We addressed this question with pGL3-CDH2 and pGL3-Cx43. The latter was previously described [37]. These two reporter genes were transiently transfected in MDA-MB-231, knockdown for CDH2, Cx43 or scramble shRNA (Figures 1C and 1D). The normalized RLU levels were significantly (p 0.05) decreased for both pGL3-CDH2 and -Cx43 in knockdown cells relative to scramble shRNA. These results indicated that CDH2 and Cx43 regulate the expression of each other at the level of transcription.
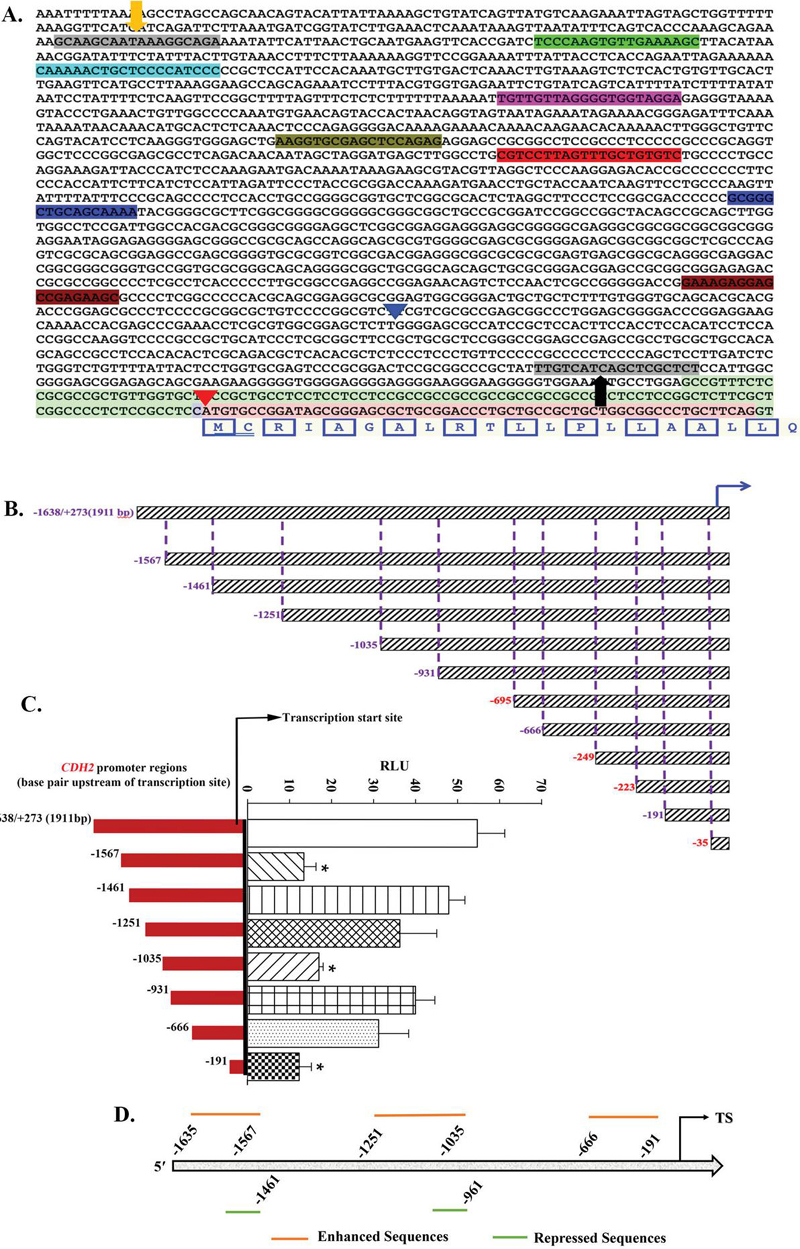
Figure 2 Cloning of various regions of the 2 kb fragment upstream of CDH2 translational start site. A) Shown are the primer designs for variable expansion of CDH2 regulatory region of genome id- NC_000018.10 on the NCBI database. The yellow and black arrow indicate the primer start and end sites. The sequences with colored highlights show the start site of different primers for variable expansion of CDH2 promoter region. B) Graphical representation of (A) with base pair (bp) distance from transcription start site. The bp in red failed either PCR amplification or its subcloning into pGL3 reporter vector. C) The fragments shown in ‘B’ were inserted in p-GL3 and then tested in BM fibroblasts for reporter activity. Luciferase activity was normalized to gal activity and presented as the mean RLUSD, n 3, right bars. The red bars at left corresponded to the fragment size of luciferase activity at right. D) Schematic representation showing the relative enhancer and repressor sequences based on the studies in ‘B’.
Due to the complex role of CDH2 with respect to regulating Cx43, we analyzed different fragments of the 2 kb CDH2 cloned sequence (Figure 2) [7]. The sequence between the yellow and black arrows in Figure 2A depicts the cloned 5 regulatory region of CDH2. The highlighted sequences in different colors represent the primer start sites used to subclone the smaller fragments of the originally cloned sequence, which is depicted in Figure 2B. The high GC content in the 5 ends of some primers prevented efficient PCR amplification (Figure 2B – red numbers).
In order to eliminate the confounds associated with multiple mutations in BCCs, we tested the pGL3-CDH2 variable inserts in stromal fibroblasts (Figure 2C). The normalized values, presented as mean RLU, indicated that inserts with deletions up to 1567, 1035, and 191 bp showed significant (p 0.05) decreases in luciferase activity. These findings indicated that the regions spanning 1638/1567 bp, 1251/1035 bp, and 666/191 bp consist of sites that could activate CDH2 regulatory regions, through enhancer elements.
There were significant (p 0.05) increases in RLU with fragments spanning 1567/1461 bp, and 1035/931 bp. These increases indicated that these omitted fragments contained sequences with possible binding sites to transcription repressors. In total, the luciferase activity of different fragments provide insights into key regulatory regions, which we summarized in Figure 2D.
Cytokines, such as TGF-1 and CXCL-12 are hematopoietic regulators, and can support BC dormancy in the BM [4, 5, 38, 39]. Low level of CXCL-12 was required to sustain Cx43-mediated GJIC between BCCs and BM stroma [37]. Similar low concentration of CXCL12 mediated GJIC [37]. TGF-1, through Smad, was reported to regulate CDH2 transcription [40, 41]. Based on the relevant roles of these two cytokines, we investigated their roles in CDH2 expression. These studies will contribute to an understanding of Cx43-mediated GJIC between BCCs and endogenous BM niche cells [7].
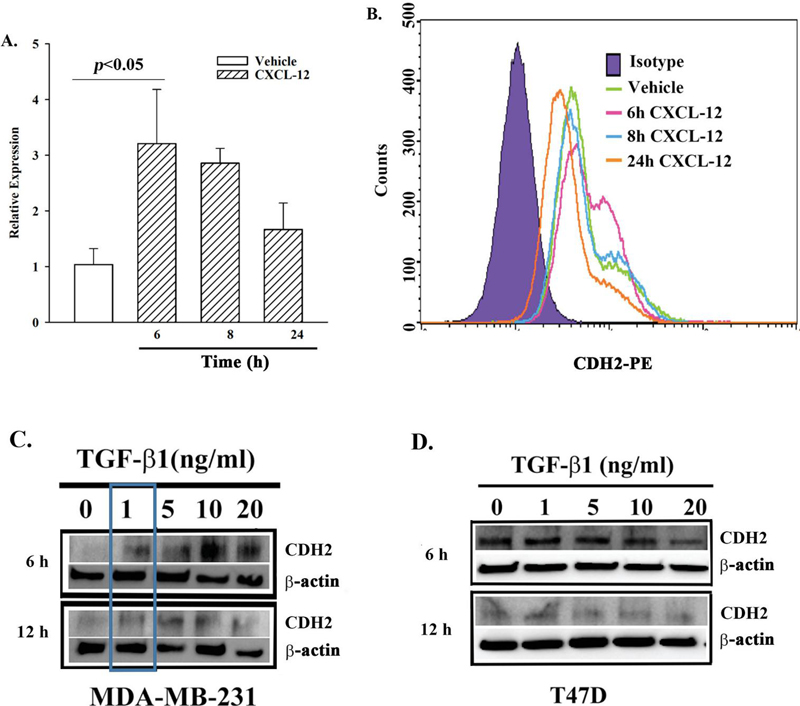
Figure 3 CDH2 expression in BCCs stimulated with CXCL-12 or TGF1. A) Real time PCR for CDH2 mRNA using total RNA from BCCs stimulated with 5 ng/mL CXCL12. The relative expressions are presented as the meanSD, n 4. B) Flow cytometry for membrane CDH2 on BCCs, stimulated with vehicle or 5 ng/ml CXCL-12. The histogram represents five independent experiments. C) BCCs (MDA-MB-231 or T47D) were stimulated with different concentrations of TGF-1. Western blots for CDH2 were performed with whole cell extracts after 6 and 12 h in culture. The membranes were stripped and reprobed for -actin. The blot represents three independent studies.
We assessed how CXCL12 regulates CDH2 expression in a time-course study with 5 ng/mL CXCL12. This concentration was responsible to activate Cx43 in establishing GJIC [37]. MDA-MB-231, stimulated with 5 ng/ml CXCL12 for different times were quantitated for CDH2 mRNA by real time PCR (Figure 3A), and CDH2 membrane protein by flow cytometry (Figure 3B). At 6 h, there was significant (p 0.05) increase in CDH2 mRNA. At the level of protein, we noted two populations of BCCs at 6 h, based on two different mean fluorescence intensities (MFI) (Figure 3B, pink histogram). These two varied MFIs indicated high and low expressions of CDH2. Interestingly, prolonged exposure (24 h) of BCCs to CXCL12 decreased CDH2 (orange histogram). Interestingly, prolonged exposure (24 h) of BCCs to CXCL12 decreased CDH2 at the protein level (orange histogram), and mRNA (Figures 3A and 3B).
TGF-1 can exert tumor suppressor and oncogenic functions, depending on the concentration [42]. At dormancy within BM stroma, TGF-1 level is generally decreased in BCCs [42]. Therefore, to understand the involvement of TGF-1 in CDH2 expression, we studied MDA-MB-231 (triple negative) and T47D (triple positive) cells in time-course and dose- response studies (Figures 3C and 3D). The expression of CDH2 increased with 1 ng/ml TGF-1 at 6 and 12 h in MDA-MB-231 (Figure 3C, boxed region). Compared to MDA-MB-231, CDH2 levels were increased in baseline T47D (Figure 3D). However, with continued TGF1 stimulation, the levels were decreased by 20 h (Figure 3D). In summary, the studies indicated that low levels of CXCL-12 and TGF-1 increased CDH2 in MDA-MB-231 by 6 h. In the case of T47D, the high baseline CDH2 protein was slowly decreased with TGF1 by 20 h.
We applied in silico programs, Genomatrix, Jasper and ConSite, to predict how CDH2 could be regulated. The output showed 200 potential regulator transcription factors (TFs) with the potential to interact with the 5 regulatory region of CDH2. Since TGF-1 and CXCL-12 are key to BC dormancy, we focused on these cytokines [4, 5, 37, 42]. We based our inquiry on the reporter activity of different fragments (Figure 2). We highlighted the relevant regions in red and green boxes (Figure 4A). The green boxes identify the regions with potential sites for TFs that potentiates CDH2 transcription. The red box depicts potential regions with binding site for negative regulators (Figure 4A). The TFs corresponding to these sites were acquired using multiple prediction programs (Figure 4B).
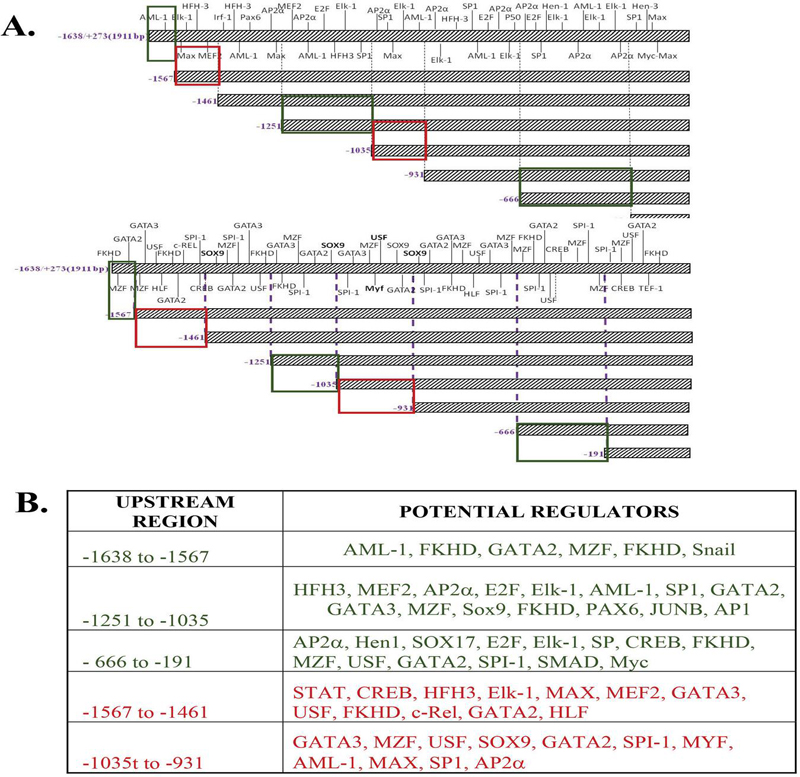
Figure 4 Potential regulators of CDH2. A) The CDH2 regulatory region was scanned for potential transcription factors (TFs) regulated by TGF-1 and CXL-12 using Genomatrix, Jasper and ConSite. Using the reporter activity with different CDH2 region, shown in Figure 2, we highlighted the regulatory regions accordingly in red or green. B) The respective TFs are listed to match the red and green boxes shown in ‘A’. The TFs in black are relevant to cell development although they did not appear in the output of each of the studied three programs.
We sought the mechanisms by which potential TFs can regulate CDH2 expression. This question was important because of the critical role of CDH2 in GJIC to sustain BC dormancy [7]. We focused on changes in miRNAs in BCCs and stroma, before and after coculture because these family of non-coding RNAs have been shown to cross GJ between BM stroma and BCCs, and can be targets to chemosensitize BCCs in BM [4, 20]. We analyzed the data from a previously reported miRNA array from our laboratory [10]. The data were acquired in studies that co-cultured T47D and BM stroma were co-cultured for 48 h. The analyses were compared with stroma and T47D cultured alone. The normalized miRNA levels in T47D and BM stroma alone, and after co-culture, are listed in Supplemental Table 2.
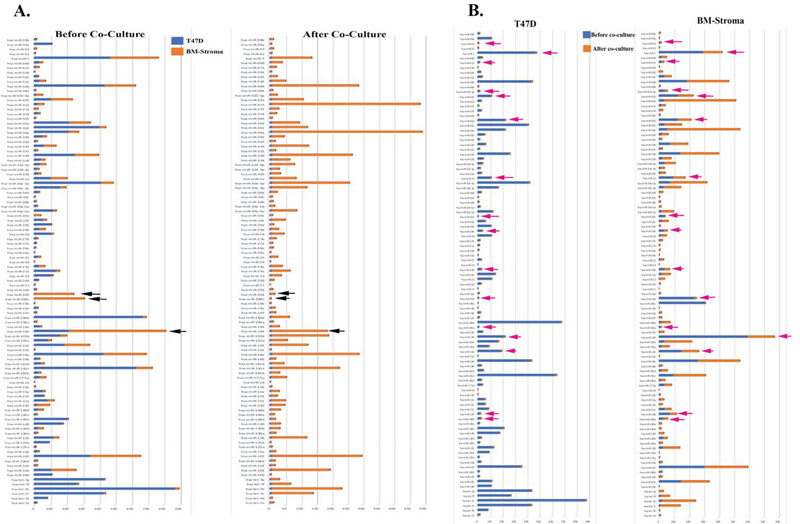
Figure 5 Overlay of miRNA array with T47D and BM stroma before and after co-culture. A) The common miRNAs expressed between T47D and Stroma were selected from the array data and its relative expression to RNU48 was graphed. The graph on the left is overlay of relative expression values before co-culture in T47D and Stroma; the graph on right shows the same after co-culture. The black arrow shows some of the miRNA that did not change before or after co-culture. See Tables 6 and 7. B) The graph on the left is overlay of relative expression values before co-culture and after co-culture in T47D; the graph on right shows the same in Stroma. The pink arrow shows the miRNA that was downregulated in T47D and stroma after their co-culture.
The relative expressions for the miRNAs were overlaid in BCC and stroma before (left) and after co-culture (right) (Figure 5A). Most miRNAs that were upregulated in T47D before co-culture were also upregulated in stroma after coculture (Figure 5A, Table 2 and Supplemental Table 1). Although some miRNAs did not change before and after co-culture (Figure 5B, left, black arrow), the miRNA profile before and after co-culture in T47D (left) and stroma (right), showed similar downregulation after co-culture in BCCs (Figure 5B, right, black arrow).
JK1cmyk0.28,0.16,0.01,0 JK2cmyk0.36,0.02,0.57,0 JK3cmyk0.06,0,0.98,0
Table 2 MiRNA profile that changes uniquely in both BM-Stroma and T47D before and after co-culture
| T47D_UNIQUE | |||
| Before co-culture | After co-culture | ||
| Relative Expr. to | Relative Expr. to | ||
| miRNA | RNU48-AVE | miRNA | RNU48-AVE |
| hsa-miR-126# | 860.7136271 | hsa-let-7d | 9.103733625 |
| JK1hsa-miR-135a | JK1177.4147933 | hsa-miR-10b | 7.214936625 |
| JK1hsa-miR-200a# | JK127.82950803 | hsa-miR-127 | 2.962794625 |
| JK1hsa-miR-326 | JK1860.2263419 | hsa-miR-132 | 7.426099625 |
| hsa-miR-340 | 416.0659743 | hsa-miR-134 | 9.046677625 |
| hsa-miR-378 | 871.2316169 | hsa-miR-135b | 7.543069625 |
| hsa-miR-381 | 481.6503821 | hsa-miR-142-3p | 4.612646625 |
| JK1hsa-miR-383 | JK1246.0685554 | hsa-miR-142-5p | 4.680792625 |
| JK1hsa-miR-489 | JK1222.1113797 | hsa-miR-143 | 7.799195625 |
| hsa-miR-491 | 883.57911 | hsa-miR-145 | 3.895859625 |
| JK1hsa-miR-501 | JK185.07813481 | hsa-miR-146a | 8.130189625 |
| hsa-miR-630 | 407.1525139 | hsa-miR-155 | 6.928463625 |
| hsa-miR-659 | 260.0008447 | JK3hsa-miR-187 | JK37.639619625 |
| JK2hsa-miR-9 | JK2508.3232821 | hsa-miR-199a | 8.203865625 |
| hsa-miR-96 | 555.1725782 | hsa-miR-199a# | 3.827868625 |
| hsa-miR-20b | 8.257344625 | ||
| hsa-miR-214 | 4.190327625 | ||
| hsa-miR-221 | 4.661856625 | ||
| hsa-miR-222 | 2.092755625 | ||
| hsa-miR-223 | 2.954279625 | ||
| hsa-miR-224 | 6.523125625 | ||
| hsa-miR-31 | 3.212225625 | ||
| hsa-miR-382 | 8.269089625 | ||
| hsa-miR-411 | 8.745472625 | ||
| hsa-miR-424 | 8.945179625 | ||
| JK3hsa-miR-432 | JK39.146042625 | ||
| hsa-miR-452 | 9.166863625 | ||
| hsa-miR-452# | 9.108357625 | ||
| hsa-miR-485-3p | 8.173462625 | ||
| hsa-miR-550 | 9.105656625 | ||
| BM-Stroma_UNIQUE | |||
| Before co-culture | After co-culture | ||
| Relative Expr. to | Relative Expr. to | ||
| miRNA | RNU48-AVE | miRNA | RNU48-AVE |
| hsa-miR-1 | 213.5157413 | JK1hsa-miR-135a | JK1227.451 |
| hsa-miR-124a | 225.4312367 | hsa-miR-141 | 71.614 |
| hsa-miR-133a | 304.0181457 | hsa-miR-182 | 25.833 |
| hsa-miR-137 | 107.2453009 | hsa-miR-183 | 99.820 |
| hsa-miR-17-3p | 380.7804567 | hsa-miR-184 | 320.341 |
| hsa-miR-190 | 414.6067014 | JK3hsa-miR-187 | JK3229.748 |
| hsa-miR-204 | 170.0840005 | hsa-miR-200a | 15.555 |
| hsa-miR-199b | 111.4083553 | JK1hsa-miR-200a# | JK1117.241 |
| hsa-miR-338 | 312.2672857 | hsa-miR-200b | 5.019 |
| hsa-miR-34b | 597.812654 | hsa-miR-205 | 19.307 |
| hsa-miR-34c | 603.8752041 | hsa-miR-216 | 600.147 |
| hsa-miR-379 | 93.29601955 | hsa-miR-20b | 452.042 |
| hsa-miR-411 | 49.1997686 | JK1hsa-miR-326 | JK1903.664 |
| hsa-miR-485-5p | 304.9569161 | hsa-miR-375 | 10.999 |
| hsa-miR-494 | 610.5406846 | JK1hsa-miR-383 | JK1266.049 |
| hsa-miR-502 | 593.8927559 | hsa-miR-410 | 517.062 |
| hsa-miR-545 | 197.2388075 | hsa-miR-429 | 46.631 |
| hsa-miR-618 | 94.83913668 | JK3hsa-miR-432# | JK3699.086 |
| hsa-miR-629 | 603.0695677 | hsa-miR-449 | 4.609 |
| hsa-miR-656 | 204.2850226 | hsa-miR-449b | 4.866 |
| JK2hsa-miR-9# | JK2351.5898532 | hsa-miR-486 | 172.336 |
| JK1hsa-miR-489 | JK1189.709 | ||
| JK1hsa-miR-501 | JK179.870 | ||
| hsa-miR-519e | 856.351 | ||
| hsa-miR-549 | 837.609 | ||
| hsa-miR-572 | 447.722 | ||
| hsa-miR-601 | 569.603 | ||
| hsa-miR-622 | 484.900 | ||
| hsa-miR-642 | 362.132 | ||
| hsa-miR-644 | 911.632 | ||
| hsa-miR-653 | 319.186 |
Assuming that the same set of miRNAs will be involved in regulating GJIC, we then focused on those that showed similar changes after co-culture in both cell types (Figure 5B, pink arrows). Table 2 (blue highlights) lists miRNAs that were downregulated after co-culture in both cell types; the yellow highlights list miRNAs that were upregulated in both after co-culture; the green highlight shows miRNA that was upregulated in BCC and downregulated in stroma after co-culture.
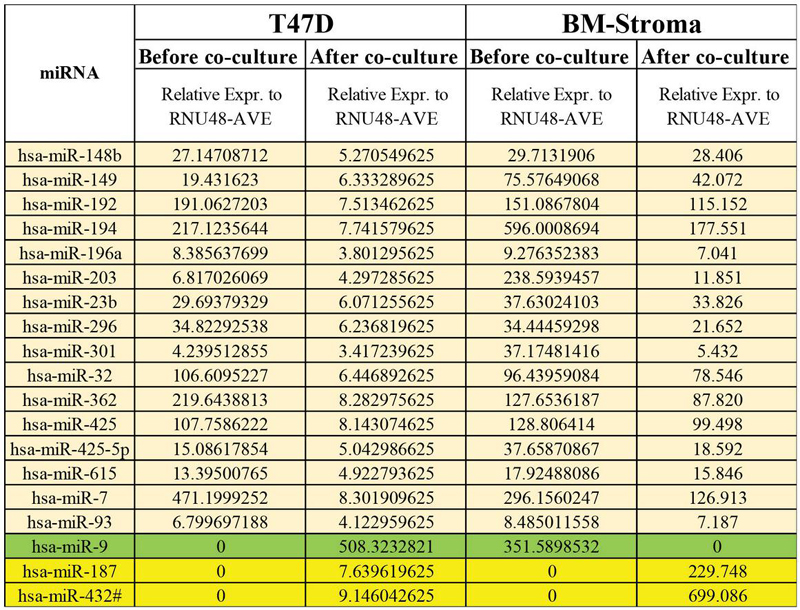
Figure 6 List of miRNAs that changed in BCCs and stroma after co-culture. The miRNAs with beige highlights were downregulated, the yellow highlight lists miRNA that were upregulated in both the cells after co-culture. The miRNA-9 (in green) was upregulated in T47D and downregulated in stroma after co-culture.
Using miRNA binding predictors target scan and miRDB, we identified potential regulators of CDH2 as miR-615, -187, -192, -9, -93, -7, -32 and -432 (Figure 6). Most of these miRNAs were predicted to regulate one or more TFs listed in Figure 4B – summarized in Table 3. Based on these findings, we combined the information on TGF1 and the miRNAs with the identified TF to propose a possible mechanism of how CDH2 could mediate dormancy and also potentiate reverse dormancy through a network of miRNAs (Figure 7).
Table 3 List of miRNAs targeting both CDH2 and TFs
| miRNA | CDH2 Regulators |
| 615 | GATA3, AML-1, SP-1, JUNB, MEF2 |
| 192 | PAX1/6, Smad2/3, JUNB |
| 93 | Samd2/3/6/7, PAX6, SP-1, AML-1, CREB, SOX9, E2F, MAX, MEF2 |
| 7 | CREB, AML-1, MYC, SP-1, PAX 1/6, Smad2/4, E2F |
| 32 | SOX9, CREB, AML-1, SP-1, PAX6, Smad2/3/4/6, E2F, MAX |
| 432 | SOX9, CREB, AML-1, SP-1, Smad2/3/4/6/7, E2F |
| 187 | CREB, AML-1, PAX1, Smad2/7 |
| 9 | GATA2, CREB1, AML-1, SP-1, Smad2/3/4/6/7, E2F, MEF2 |
| The list shown is based on the highlighted data in Table 2. These miRNAs have the potential to target CDH2, and the different TFs listed in Figure 71. | |
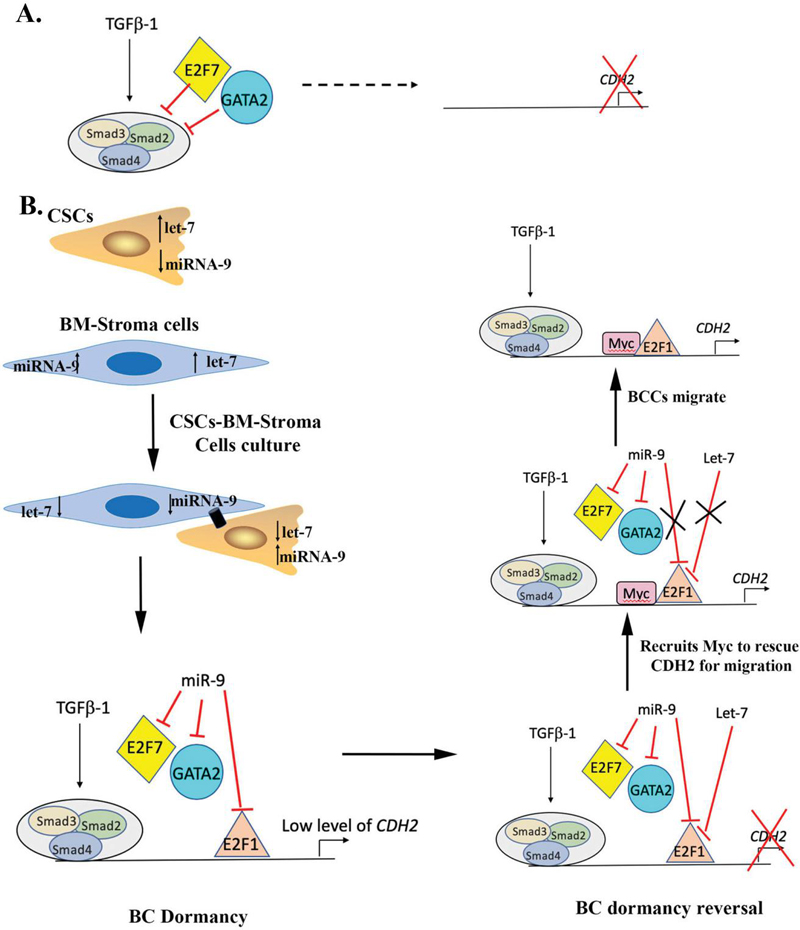
Figure 7 Possible mechanism of regulation of CDH2 by miRNA-9 and let-7. A) Based on the region E2F7 (belongs to inhibitory E2F family) along with GATA2 either directly binds to CDH2 regulatory region or Smad family to inhibit its expression. B) Based on the miRNA data, miR-9 level upon co-culture is increased in CSCs and let-7 is decreased. The upregulation of miR-9 potentially inhibits E2F7 and GATA2 to upregulated CDH2. Thus, during BC dormancy GJIC formation, CDH2 is needed at low level. In order to maintain CDH2 at low level, miR-9 possibly targets E2F1 (belongs to activator E2F family), to keep a check on CDH2 expression. During BC reversal/migration the let-7 binds to E2F1 to completely inhibit CDH2 expression, which signals recruitment of Myc for the upregulation of CDH2 and E2F.
This report provides insights into how CDH2 is regulated to facilitate GJIC with BM endogenous cells [7]. In our previous studies, omics analyses indicated that Cx43 and CDH2 might have a common pathway for the survival of BCCs [7]. This study suggested that Cx43 might be regulating the expression of CDH2 and vice versa (Figure 1A). Cytokines within the BM microenvironment can support BC dormancy. CSC maintenance occurs by low level of CXCL-12, which activates protein kinase C, resulting in phosphorylation of Cx43 to open the GJ pore [4, 5, 43]. Intercellular interaction between Cx43 and CDH2 are a requisite for membrane localization of Cx43 to establish GJIC [7, 22, 23]. Despite the link between EMT and CDH2, our report indicated that the role of CDH2 is not limited to EMT [7]. Indeed, we now show at two of these cytokines, TGF-1 and CXCL12, can regulate CDH2 protein (Figure 3). This was insightful because CDH2 is needed for Cx43 to migrate to the membrane to establish GJIC with BM niche cells [7]. Since targeting of Cx43 is likely to exert toxic effects in the BM, due to its role in hematopoiesis, this study using the cloned 5 regulatory region of CDH2 provided insights into CDH2 regulation [44]. The information was achieved with reporter gene assays to identify regions with the potential to activate or suppress the activation of CDH2 (Figure 2).
CDH2 transcription is further complicated by the Notch pathway [45]. -secretase, a catalytic enzyme, cleaves NOTCH receptor at the transmembrane region to release Notch intracellular domain (NICD), which then complexes with Smad family to regulate CDH2 [45]. Further, -secretase can also cleave membrane CDH2 at the transmembrane region releasing the catenins to maintain CSCs [46]. This was important and explains the role of TGF-1 in dormancy.
Cloning of the CDH2 5 regulatory region identified predicted TF, which we were able to link to the activating and suppressor regions (Figure 4). We further narrow the relevant TF, based on the importance of TGF1 and CXCL-12 in regulating both BC dormancy and its reversal, especially within the BM niche [3, 10, 37]. Using the intracellular pathways of TGF1 and CXCL-12 stimulation, we were able to narrow the TFs that can probably potentiate CDH2 from a total of 200 down to 27 (Figure 4).
Since miRNA can be exchanged through GJIC [4], we asked if these miRNAs could regulate the identified TFs. We analyzed data from previously reported miRNA arrays in which BCCs were cocultured with BM stroma [4]. We were able to identify potential miRNAs that can target both CDH2 and some of the identified TFs (Table 3). For example, miR-9 which was upregulated in BCCs after co-culture with BM stroma also regulates E2F (Table 3). Interestingly, E2F-associated pathways were upregulated upon CDH2 knockdown [7]. Upon GJIC between BCCs and stroma, miR-9 was upregulated in the malignant cells. These findings suggest that miR-9 might be preventing binding of GATA2 to E2F (Figure 7). This possibly prevents the formation of the GATA2/E2F/Smad inhibitory complex (Figure 7). At the same time, miR-9 can also potentially bind to E2F1 (an activator E2F) to control CDH2 expression. Subsequently, upon receiving the signal for reversal of dormancy from microenvironment, let-7 increase in BCCs can additionally target E2F1, thus leading to almost complete loss of CDH2. This can trigger recruitment of Myc, which is another TF important for CDH2 regulation (Figure 7) [47]. Thus, upon complete loss of CDH2 and E2F1, Myc is potentially recruited to induce migration and proliferation (Figure 7). These findings are ongoing in our group and will provide further understanding of CDH2 regulation in both BC dormancy and during reverse dormancy when migration and proliferation occur.
We were surprised with the increase in CDH2 when Cx43 was knocked down and vice versa (Figure 1A). This indicated the complex regulation of CDH2 to control Cx43 to cell membrane for GJIC. We gained insights into this complex regulation when the predicted TFs and miRNAs were mapped to analyze how they could regulate the differential expression of CDH2. This miR-CDH2 axis has to be considered when examining the role of CDH2, which is not limited to GJIC. CDH2 mediated chemoresistance in BCCs, which was reversed by pharmacological and molecular methods [7]. CDH2 also lose their ability to self-renew with an increase in apoptotic pathways [7]. We showed decreased CDH2 increased the proliferation of otherwise dormant CSCs [7]. Interestingly, cloning of CDH2 regulatory region and links to miRs and TFs have provided insights into how reduced CDH2 could reverse dormancy (Figure 7).
Most therapeutic interventions are designed to target dividing cells; therefore, with an understanding of CDH2 in CSC/dormant BCCs maintenance, these CSC can now be chemosensitized with patient-specific chemotherapies (Figure 7). Indeed, we showed how targeting of -secretase could differentiate the CSCs into chemosensitive cells [7]. We propose that these findings, as well as our other report can repurpose drugs to hasten the treatment of dormant CSCs. The pathways developed in Figure 7 identified potential drug targets. It is possible to target miRs by delivering to the BM with mesenchymal stem cells (MSCs) [20]. This approach has been shown to be feasible with the advantage of BM-derived MSCs with apparent memory to migrate to the BM, and the ability of anti-miRs to chemosensitize the dormant BCCs [20].
[1] Siegel, R.L., K.D. Miller, and A. Jemal, Cancer statistics, 2020. CA Cancer J Clin, 2020. 70(1): p. 7–30.
[2] Minn, A.J., et al., Distinct organ-specific metastatic potential of individual breast cancer cells and primary tumors. J Clin Invest, 2005. 115(1): p. 44–55.
[3] Patel, S.A., et al., Treg/Th17 polarization by distinct subsets of breast cancer cells is dictated by the interaction with mesenchymal stem cells. J Cancer Stem Cell Res, 2014. 2014(2).
[4] Lim, P.K., et al., Gap junction-mediated import of microRNA from bone marrow stromal cells can elicit cell cycle quiescence in breast cancer cells. Cancer Res, 2011. 71(5): p. 1550–60.
[5] Moharita, A.L., et al., SDF-1alpha regulation in breast cancer cells contacting bone marrow stroma is critical for normal hematopoiesis. Blood, 2006. 108(10): p. 3245–52.
[6] Moore, C.A., et al., A 3D Bioprinted Material That Recapitulates the Perivascular Bone Marrow Structure for Sustained Hematopoietic and Cancer Models. Polymers (Basel), 2021. 13(4).
[7] Sinha, G., et al., Specific N-cadherin-dependent pathways drive human breast cancer dormancy in bone marrow. Life Sci Alliance, 2021. 4(7).
[8] Demicheli, R., M. Terenziani, and G. Bonadonna, Estimate of tumor growth time for breast cancer local recurrences: rapid growth after wake-up? Breast Cancer Res Treat, 1998. 51(2): p. 133–7.
[9] Mansi, J.L., et al., The fate of bone marrow micrometastases in patients with primary breast cancer. J Clin Oncol, 1989. 7(4): p. 445–9.
[10] Patel, S.A., et al., Delineation of breast cancer cell hierarchy identifies the subset responsible for dormancy. Sci Rep, 2012. 2: p. 906.
[11] Mansi, J., et al., Bone marrow micrometastases in early breast cancer-30-year outcome. Br J Cancer, 2016. 114(3): p. 243–7.
[12] Dawood, S., L. Austin, and M. Cristofanilli, Cancer Stem Cells: Implications for Cancer Therapy. Oncology (Williston Park), 2014. 28(12).
[13] Rahim, F., et al., Molecular regulation of bone marrow metastasis in prostate and breast cancer. Bone Marrow Res, 2014. 2014: p. 405920.
[14] Malladi, S., et al., Metastatic Latency and Immune Evasion through Autocrine Inhibition of WNT. Cell, 2016. 165(1): p. 45–60.
[15] Correction: Cytokeratin-Positive Cells in the Bone Marrow and Survival of Patients with Stage I, II, or III Breast Cancer. N Engl J Med, 2000. 343(4): p. 308.
[16] Braun, S., et al., Lack of effect of adjuvant chemotherapy on the elimination of single dormant tumor cells in bone marrow of high-risk breast cancer patients. J Clin Oncol, 2000. 18(1): p. 80–6.
[17] Habeck, M., Bone-marrow analysis predicts breast-cancer recurrence. Mol Med Today, 2000. 6(7): p. 256–7.
[18] Corcoran, K.E., et al., Mesenchymal Stem Cells in Early Entry of Breast Cancer into Bone Marrow. PLOS ONE, 2008. 3(6): p. e2563.
[19] Sandiford, O.A., et al., Mesenchymal Stem Cell-Secreted Extracellular Vesicles Instruct Stepwise Dedifferentiation of Breast Cancer Cells into Dormancy at the Bone Marrow Perivascular Region. Cancer Res, 2021. 81(6): p. 1567–1582.
[20] Bliss, S.A., et al., Mesenchymal Stem Cell-Derived Exosomes Stimulate Cycling Quiescence and Early Breast Cancer Dormancy in Bone Marrow. Cancer Res, 2016. 76(19): p. 5832–5844.
[21] Onitilo, A.A., et al., Breast cancer subtypes based on ER/PR and Her2 expression: comparison of clinicopathologic features and survival. Clin Med Res, 2009. 7(1–2): p. 4–13.
[22] Matsuda, T., et al., N-cadherin signals through Rac1 determine the localization of connexin 43 in cardiac myocytes. J Mol Cell Cardiol, 2006. 40(4): p. 495–502.
[23] Taniguchi Ishikawa, E., et al., Connexin-43 prevents hematopoietic stem cell senescence through transfer of reactive oxygen species to bone marrow stromal cells. Proc Natl Acad Sci U S A, 2012. 109(23): p. 9071–6.
[24] MacNamara, K.C., et al., Transient activation of hematopoietic stem and progenitor cells by IFNgamma during acute bacterial infection. PLoS One, 2011. 6(12): p. e28669.
[25] Reya, T., et al., Stem cells, cancer, and cancer stem cells. Nature, 2001. 414(6859): p. 105–11.
[26] Wei, C.J., et al., Connexin43 associated with an N-cadherin-containing multiprotein complex is required for gap junction formation in NIH3T3 cells. J Biol Chem, 2005. 280(20): p. 19925–36.
[27] Soh, B.S., et al., N-cadherin prevents the premature differentiation of anterior heart field progenitors in the pharyngeal mesodermal microenvironment. Cell Res, 2014. 24(12): p. 1420–32.
[28] Zuppinger, C., M. Eppenberger-Eberhardt, and H.M. Eppenberger, N-Cadherin: structure, function and importance in the formation of new intercalated disc-like cell contacts in cardiomyocytes. Heart Fail Rev, 2000. 5(3): p. 251–7.
[29] Wahl, J.K., 3rd, et al., N-cadherin-catenin complexes form prior to cleavage of the proregion and transport to the plasma membrane. J Biol Chem, 2003. 278(19): p. 17269–76.
[30] Kim, J.B., et al., N-Cadherin extracellular repeat 4 mediates epithelial to mesenchymal transition and increased motility. J Cell Biol, 2000. 151(6): p. 1193–206.
[31] Mrozik, K.M., et al., N-cadherin in cancer metastasis, its emerging role in haematological malignancies and potential as a therapeutic target in cancer. BMC Cancer, 2018. 18(1): p. 939.
[32] Corcoran, K.E., et al., Mesenchymal stem cells in early entry of breast cancer into bone marrow. PLoS One, 2007. 3: p. e2563.
[33] Singh, D., et al., Increased expression of preprotachykinin-I and neurokinin receptors in human breast cancer cells: implications for bone marrow metastasis. Proc Natl Acad Sci U S A, 2000. 97(1): p. 388–93.
[34] Ghazaryan, S., et al., Inactivation of Rb and E2f8 synergizes to trigger stressed DNA replication during erythroid terminal differentiation. Mol Cell Biol, 2014. 34(15): p. 2833–47.
[35] Qian, J., et al., Cloning of human preprotachykinin-I promoter and the role of cyclic adenosine 5-monophosphate response elements in its expression by IL-1 and stem cell factor. J Immunol, 2001. 166(4): p. 2553–61.
[36] Kotini, M., et al., Gap junction protein Connexin-43 is a direct transcriptional regulator of N-cadherin in vivo. Nat Commun, 2018. 9(1): p. 3846.
[37] Park, J.M., et al., Exogenous CXCL12 activates protein kinase C to phosphorylate connexin 43 for gap junctional intercellular communication among confluent breast cancer cells. Cancer Letters, 2013. 331(1): p. 84–91.
[38] Ramamoorthi, G., et al., Disseminated cancer cells in breast cancer: Mechanism of dissemination and dormancy and emerging insights on therapeutic opportunities. Seminars in Cancer Biology, 2022. 78: p. 78–89.
[39] Ho, Y.-H. and S. Méndez-Ferrer, Microenvironmental contributions to hematopoietic stem cell aging. Haematologica, 2020. 105(1): p. 38–46.
[40] Buijs, J.T., et al., The BMP2/7 heterodimer inhibits the human breast cancer stem cell subpopulation and bone metastases formation. Oncogene, 2012. 31(17): p. 2164–74.
[41] Yang, H., et al., TGF-beta-activated SMAD3/4 complex transcriptionally upregulates N-cadherin expression in non-small cell lung cancer. Lung Cancer, 2015. 87(3): p. 249–57.
[42] Oh, H.S., et al., Bone marrow stroma influences transforming growth factor-beta production in breast cancer cells to regulate c-myc activation of the preprotachykinin-I gene in breast cancer cells. Cancer Res, 2004. 64(17): p. 6327–36.
[43] Park, J.M., et al., Exogenous CXCL12 activates protein kinase C to phosphorylate connexin 43 for gap junctional intercellular communication among confluent breast cancer cells. Cancer Lett, 2013. 331(1): p. 84–91.
[44] Singh, A.K. and J.A. Cancelas, Gap Junctions in the Bone Marrow Lympho-Hematopoietic Stem Cell Niche, Leukemia Progression, and Chemoresistance. Int J Mol Sci, 2020. 21(3).
[45] Li, F., et al., Endothelial Smad4 maintains cerebrovascular integrity by activating N-cadherin through cooperation with Notch. Dev Cell, 2011. 20(3): p. 291–302.
[46] Niessen, C.M., D. Leckband, and A.S. Yap, Tissue organization by cadherin adhesion molecules: dynamic molecular and cellular mechanisms of morphogenetic regulation. Physiol Rev, 2011. 91(2): p. 691–731.
[47] Chen, C.R., et al., E2F4/5 and p107 as Smad cofactors linking the TGFbeta receptor to c-myc repression. Cell, 2002. 110(1): p. 19–32.
International Journal of Translational Science, Vol. 1, 3–28.
doi: 10.13052/ijts2246-8765.2024.001
© 2024 River Publishers